29
/
en
AIzaSyAYiBZKx7MnpbEhh9jyipgxe19OcubqV5w
April 1, 2024
93716
Bulgaria
BGR
true
2
1
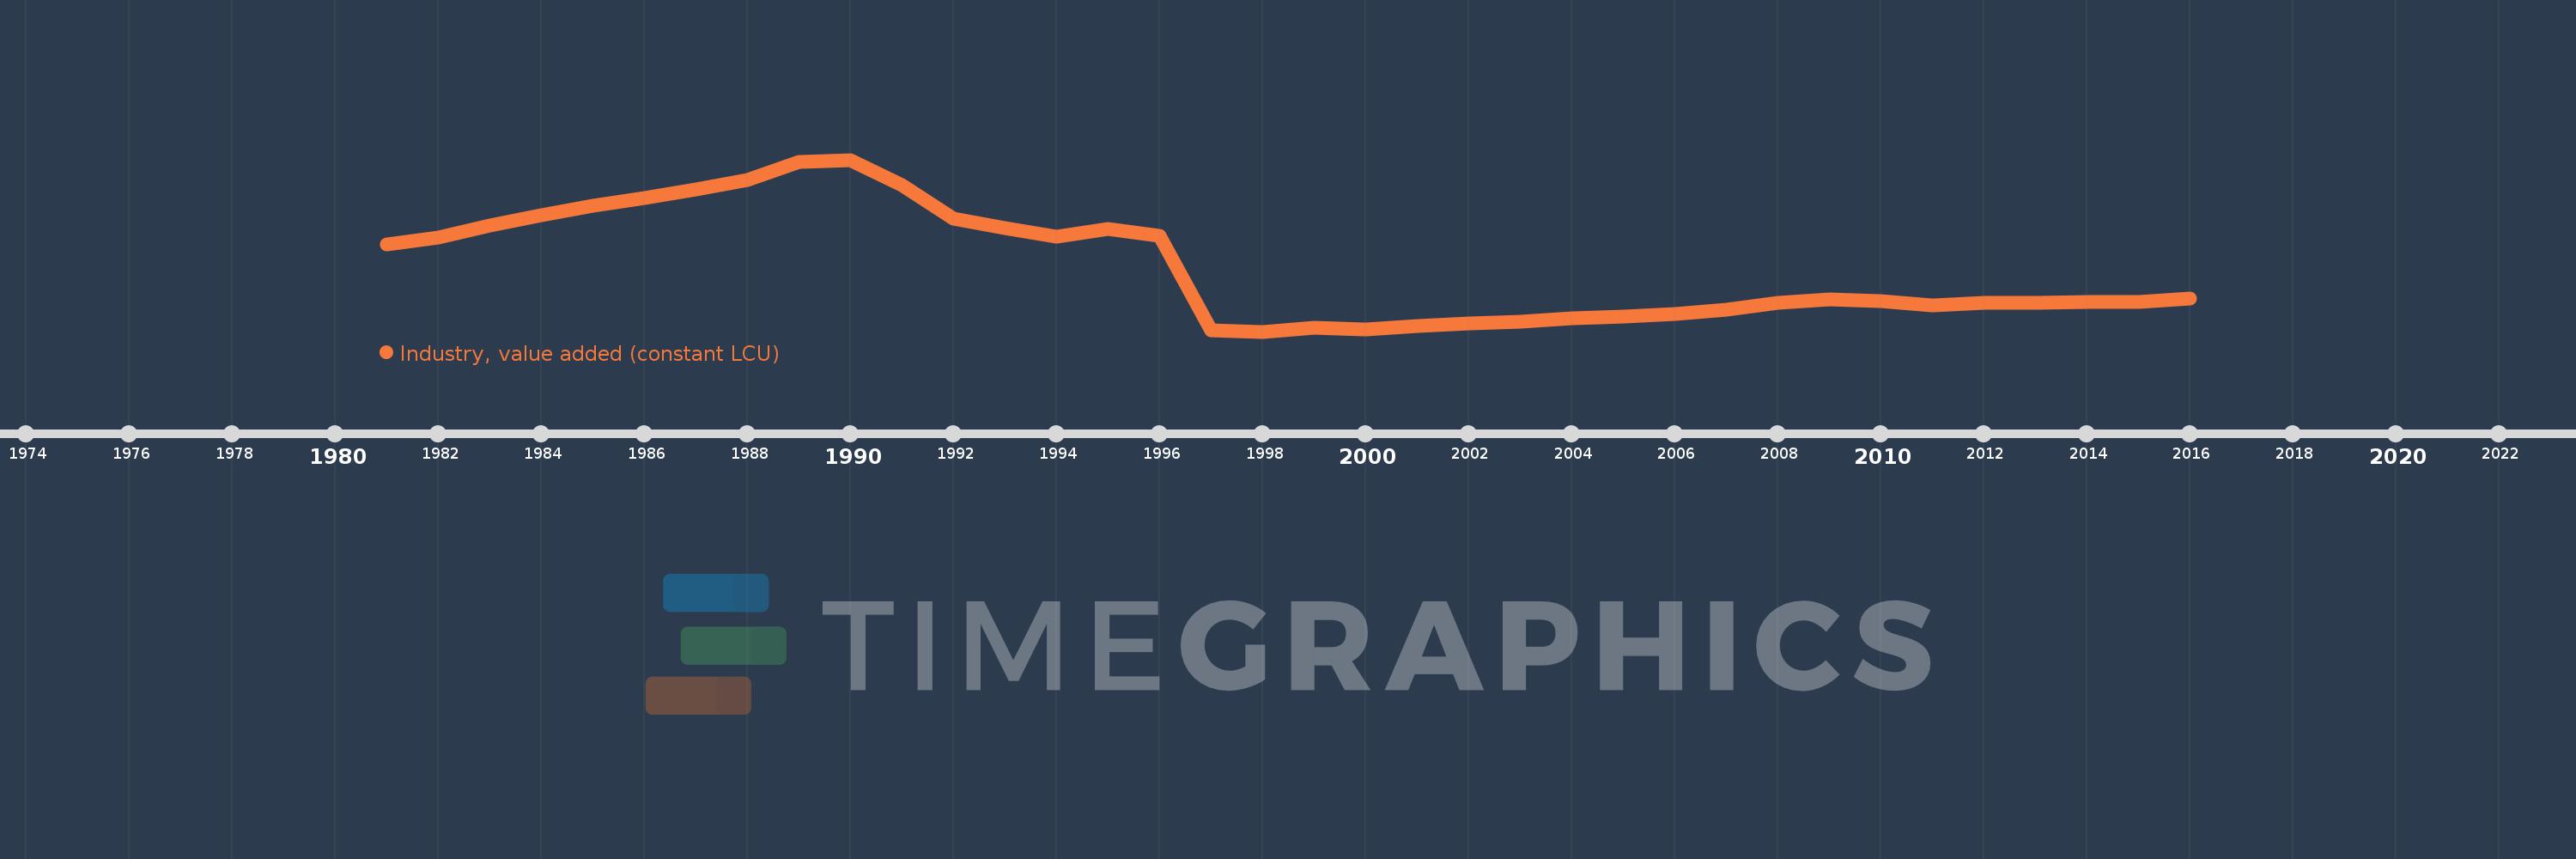
Industry, value added (constant LCU)
2016,2015,2014,2013,2012,2011,2010,2009,2008,2007,2006,2005,2004,2003,2002,2001,2000,1999,1998,1997,1996,1995,1994,1993,1992,1991,1990,1989,1988,1987,1986,1985,1984,1983,1982,1981
This statistics in other country:
AfghanistanAlbaniaAlgeriaAntigua and BarbudaArgentinaArmeniaAustraliaAustriaAzerbaijanBahamas, TheBahrainBangladeshBelarusBelgiumBelizeBeninBermudaBhutanBoliviaBosnia and HerzegovinaBotswanaBrazilBrunei DarussalamBulgariaBurkina FasoBurundiCabo VerdeCambodiaCameroonCanadaCayman IslandsCentral African RepublicChadChileChinaColombiaComorosCongo, Dem. Rep.Congo, Rep.Costa RicaCote d'IvoireCroatiaCubaCyprusCzech RepublicDenmarkDjiboutiDominicaDominican RepublicEcuadorEgypt, Arab Rep.El SalvadorEquatorial GuineaEritreaEstoniaEthiopiaFijiFinlandFranceGabonGambia, TheGeorgiaGermanyGhanaGreeceGrenadaGuatemalaGuineaGuinea-BissauGuyanaHaitiHondurasHong Kong SAR, ChinaHungaryIcelandIndiaIndonesiaIran, Islamic Rep.IraqIrelandItalyJamaicaJapanJordanKazakhstanKenyaKiribatiKorea, Rep.KosovoKuwaitKyrgyz RepublicLao PDRLatviaLebanonLesothoLiberiaLithuaniaLuxembourgMacedonia, FYRMadagascarMalawiMalaysiaMaldivesMaliMarshall IslandsMauritaniaMauritiusMexicoMicronesia, Fed. Sts.MoldovaMongoliaMontenegroMoroccoMozambiqueMyanmarNamibiaNepalNetherlandsNew ZealandNicaraguaNigerNigeriaNorwayOmanPakistanPalauPanamaPapua New GuineaParaguayPeruPhilippinesPolandPortugalPuerto RicoQatarRomaniaRussian FederationRwandaSamoaSao Tome and PrincipeSaudi ArabiaSenegalSerbiaSeychellesSierra LeoneSingaporeSlovak RepublicSloveniaSolomon IslandsSomaliaSouth AfricaSpainSri LankaSt. Kitts and NevisSt. LuciaSt. Vincent and the GrenadinesSudanSurinameSwazilandSwedenSwitzerlandSyrian Arab RepublicTajikistanTanzaniaThailandTimor-LesteTogoTongaTrinidad and TobagoTunisiaTurkeyTurkmenistanTuvaluUgandaUkraineUnited Arab EmiratesUnited KingdomUnited StatesUruguayUzbekistanVanuatuVenezuela, RBVietnamWest Bank and GazaZambiaZimbabwe Timeline:
This timeline shows a graph from 1981 to 2016 of Bulgaria. No data until 1980. Number of actual observations by date: 36.
Source name:
World Development Indicators
Source organization:
World Bank national accounts data, and OECD National Accounts data files.
Categories, topics:
Economy & Growth
Last updated:
apr 23, 2017
Indicators value changes by year
Minimum:
9.872 bln
jan 1, 1998
Maximum:
61.519 bln
jan 1, 1990
At the date of observation
Value
Absolute change
Change from previous value
jan 1, 1981
36.12 bln
+36.12 bln
0.0%
jan 1, 1982
38.095 bln
+1.975 bln
5.47%
jan 1, 1983
41.656 bln
+3.561 bln
9.35%
jan 1, 1984
44.838 bln
+3.182 bln
7.64%
jan 1, 1985
47.587 bln
+2.749 bln
6.13%
jan 1, 1986
50.011 bln
+2.424 bln
5.09%
jan 1, 1987
52.608 bln
+2.597 bln
5.19%
jan 1, 1988
55.435 bln
+2.827 bln
5.37%
jan 1, 1989
60.931 bln
+5.496 bln
9.91%
jan 1, 1990
61.519 bln
+588.112 mln
0.97%
jan 1, 1991
53.829 bln
-7.69 bln
-12.5%
jan 1, 1992
43.817 bln
-10.012 bln
-18.6%
jan 1, 1993
41.013 bln
-2.804 bln
-6.4%
jan 1, 1994
38.47 bln
-2.543 bln
-6.2%
jan 1, 1995
40.778 bln
+2.308 bln
6.0%
jan 1, 1996
38.576 bln
-2.202 bln
-5.4%
jan 1, 1997
10.161 bln
-28.415 bln
-73.66%
jan 1, 1998
9.872 bln
-288.536 mln
-2.84%
jan 1, 1999
11.08 bln
+1.208 bln
12.24%
jan 1, 2000
10.482 bln
-598.346 mln
-5.4%
jan 1, 2001
11.67 bln
+1.188 bln
11.33%
jan 1, 2002
12.285 bln
+615.303 mln
5.27%
jan 1, 2003
12.887 bln
+602.128 mln
4.9%
jan 1, 2004
13.808 bln
+920.935 mln
7.15%
jan 1, 2005
14.37 bln
+561.981 mln
4.07%
jan 1, 2006
15.111 bln
+741.089 mln
5.16%
jan 1, 2007
16.469 bln
+1.357 bln
8.98%
jan 1, 2008
18.589 bln
+2.12 bln
12.87%
jan 1, 2009
19.642 bln
+1.053 bln
5.67%
jan 1, 2010
18.964 bln
-677.519 mln
-3.45%
jan 1, 2011
17.802 bln
-1.162 bln
-6.13%
jan 1, 2012
18.531 bln
+728.2 mln
4.09%
jan 1, 2013
18.478 bln
-52.941 mln
-0.29%
jan 1, 2014
18.845 bln
+366.852 mln
1.99%
jan 1, 2015
18.908 bln
+63.431 mln
0.34%
jan 1, 2016
19.694 bln
+786.432 mln
4.16%
Ranking of countries by current statistics by years


Comments: