29
/
en
AIzaSyAYiBZKx7MnpbEhh9jyipgxe19OcubqV5w
April 1, 2024
64863
Albania
ALB
true
2
1
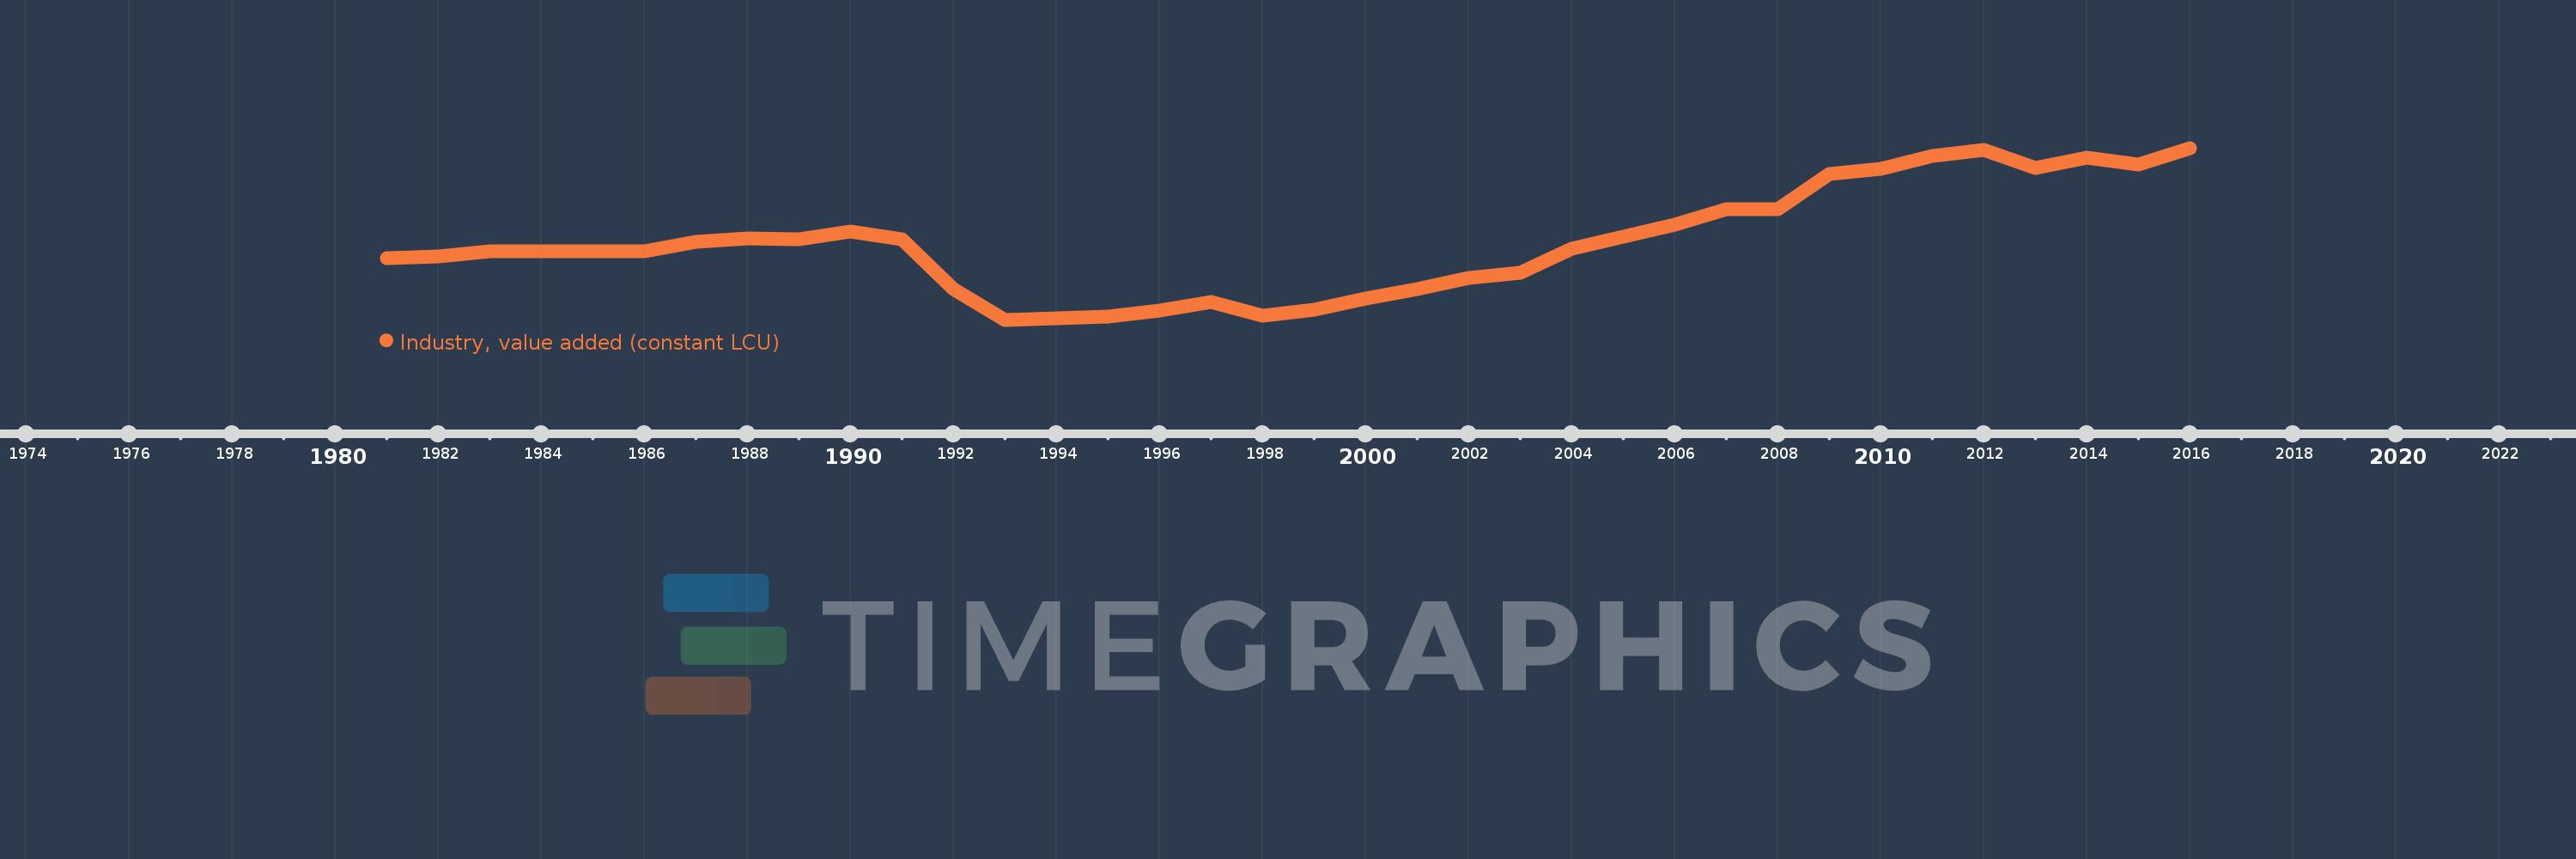
Industry, value added (constant LCU)
2016,2015,2014,2013,2012,2011,2010,2009,2008,2007,2006,2005,2004,2003,2002,2001,2000,1999,1998,1997,1996,1995,1994,1993,1992,1991,1990,1989,1988,1987,1986,1985,1984,1983,1982,1981
This statistics in other country:
AfghanistanAlbaniaAlgeriaAntigua and BarbudaArgentinaArmeniaAustraliaAustriaAzerbaijanBahamas, TheBahrainBangladeshBelarusBelgiumBelizeBeninBermudaBhutanBoliviaBosnia and HerzegovinaBotswanaBrazilBrunei DarussalamBulgariaBurkina FasoBurundiCabo VerdeCambodiaCameroonCanadaCayman IslandsCentral African RepublicChadChileChinaColombiaComorosCongo, Dem. Rep.Congo, Rep.Costa RicaCote d'IvoireCroatiaCubaCyprusCzech RepublicDenmarkDjiboutiDominicaDominican RepublicEcuadorEgypt, Arab Rep.El SalvadorEquatorial GuineaEritreaEstoniaEthiopiaFijiFinlandFranceGabonGambia, TheGeorgiaGermanyGhanaGreeceGrenadaGuatemalaGuineaGuinea-BissauGuyanaHaitiHondurasHong Kong SAR, ChinaHungaryIcelandIndiaIndonesiaIran, Islamic Rep.IraqIrelandItalyJamaicaJapanJordanKazakhstanKenyaKiribatiKorea, Rep.KosovoKuwaitKyrgyz RepublicLao PDRLatviaLebanonLesothoLiberiaLithuaniaLuxembourgMacedonia, FYRMadagascarMalawiMalaysiaMaldivesMaliMarshall IslandsMauritaniaMauritiusMexicoMicronesia, Fed. Sts.MoldovaMongoliaMontenegroMoroccoMozambiqueMyanmarNamibiaNepalNetherlandsNew ZealandNicaraguaNigerNigeriaNorwayOmanPakistanPalauPanamaPapua New GuineaParaguayPeruPhilippinesPolandPortugalPuerto RicoQatarRomaniaRussian FederationRwandaSamoaSao Tome and PrincipeSaudi ArabiaSenegalSerbiaSeychellesSierra LeoneSingaporeSlovak RepublicSloveniaSolomon IslandsSomaliaSouth AfricaSpainSri LankaSt. Kitts and NevisSt. LuciaSt. Vincent and the GrenadinesSudanSurinameSwazilandSwedenSwitzerlandSyrian Arab RepublicTajikistanTanzaniaThailandTimor-LesteTogoTongaTrinidad and TobagoTunisiaTurkeyTurkmenistanTuvaluUgandaUkraineUnited Arab EmiratesUnited KingdomUnited StatesUruguayUzbekistanVanuatuVenezuela, RBVietnamWest Bank and GazaZambiaZimbabwe Timeline:
This timeline shows a graph from 1981 to 2016 of Albania. No data until 1980. Number of actual observations by date: 36.
Source name:
World Development Indicators
Source organization:
World Bank national accounts data, and OECD National Accounts data files.
Categories, topics:
Economy & Growth
Last updated:
apr 23, 2017
Indicators value changes by year
Minimum:
35.609 bln
jan 1, 1993
Maximum:
176.002 bln
jan 1, 2016
At the date of observation
Value
Absolute change
Change from previous value
jan 1, 1981
86.269 bln
+86.269 bln
0.0%
jan 1, 1982
87.172 bln
+902.288 mln
1.05%
jan 1, 1983
91.412 bln
+4.24 bln
4.86%
jan 1, 1984
91.367 bln
-44.995 mln
-0.05%
jan 1, 1985
91.682 bln
+314.995 mln
0.34%
jan 1, 1986
91.83 bln
+147.971 mln
0.16%
jan 1, 1987
99.022 bln
+7.193 bln
7.83%
jan 1, 1988
101.799 bln
+2.776 bln
2.8%
jan 1, 1989
101.449 bln
-350.077 mln
-0.34%
jan 1, 1990
107.818 bln
+6.369 bln
6.28%
jan 1, 1991
101.359 bln
-6.459 bln
-5.99%
jan 1, 1992
60.621 bln
-40.737 bln
-40.19%
jan 1, 1993
35.609 bln
-25.012 bln
-41.26%
jan 1, 1994
36.489 bln
+879.852 mln
2.47%
jan 1, 1995
38.211 bln
+1.721 bln
4.72%
jan 1, 1996
43.025 bln
+4.815 bln
12.6%
jan 1, 1997
49.846 bln
+6.821 bln
15.85%
jan 1, 1998
38.682 bln
-11.164 bln
-22.4%
jan 1, 1999
43.563 bln
+4.882 bln
12.62%
jan 1, 2000
53.239 bln
+9.675 bln
22.21%
jan 1, 2001
60.575 bln
+7.336 bln
13.78%
jan 1, 2002
69.983 bln
+9.408 bln
15.53%
jan 1, 2003
74.009 bln
+4.026 bln
5.75%
jan 1, 2004
93.402 bln
+19.393 bln
26.2%
jan 1, 2005
103.573 bln
+10.171 bln
10.89%
jan 1, 2006
113.219 bln
+9.647 bln
9.31%
jan 1, 2007
126.17 bln
+12.95 bln
11.44%
jan 1, 2008
125.655 bln
-514.601 mln
-0.41%
jan 1, 2009
154.861 bln
+29.206 bln
23.24%
jan 1, 2010
159.138 bln
+4.277 bln
2.76%
jan 1, 2011
169.777 bln
+10.64 bln
6.69%
jan 1, 2012
174.331 bln
+4.553 bln
2.68%
jan 1, 2013
159.377 bln
-14.954 bln
-8.58%
jan 1, 2014
168.272 bln
+8.895 bln
5.58%
jan 1, 2015
162.214 bln
-6.058 bln
-3.6%
jan 1, 2016
176.002 bln
+13.788 bln
8.5%
Ranking of countries by current statistics by years


Comments: