29
/
en
AIzaSyAYiBZKx7MnpbEhh9jyipgxe19OcubqV5w
April 1, 2024
68933
Antigua and Barbuda
ATG
true
2
1
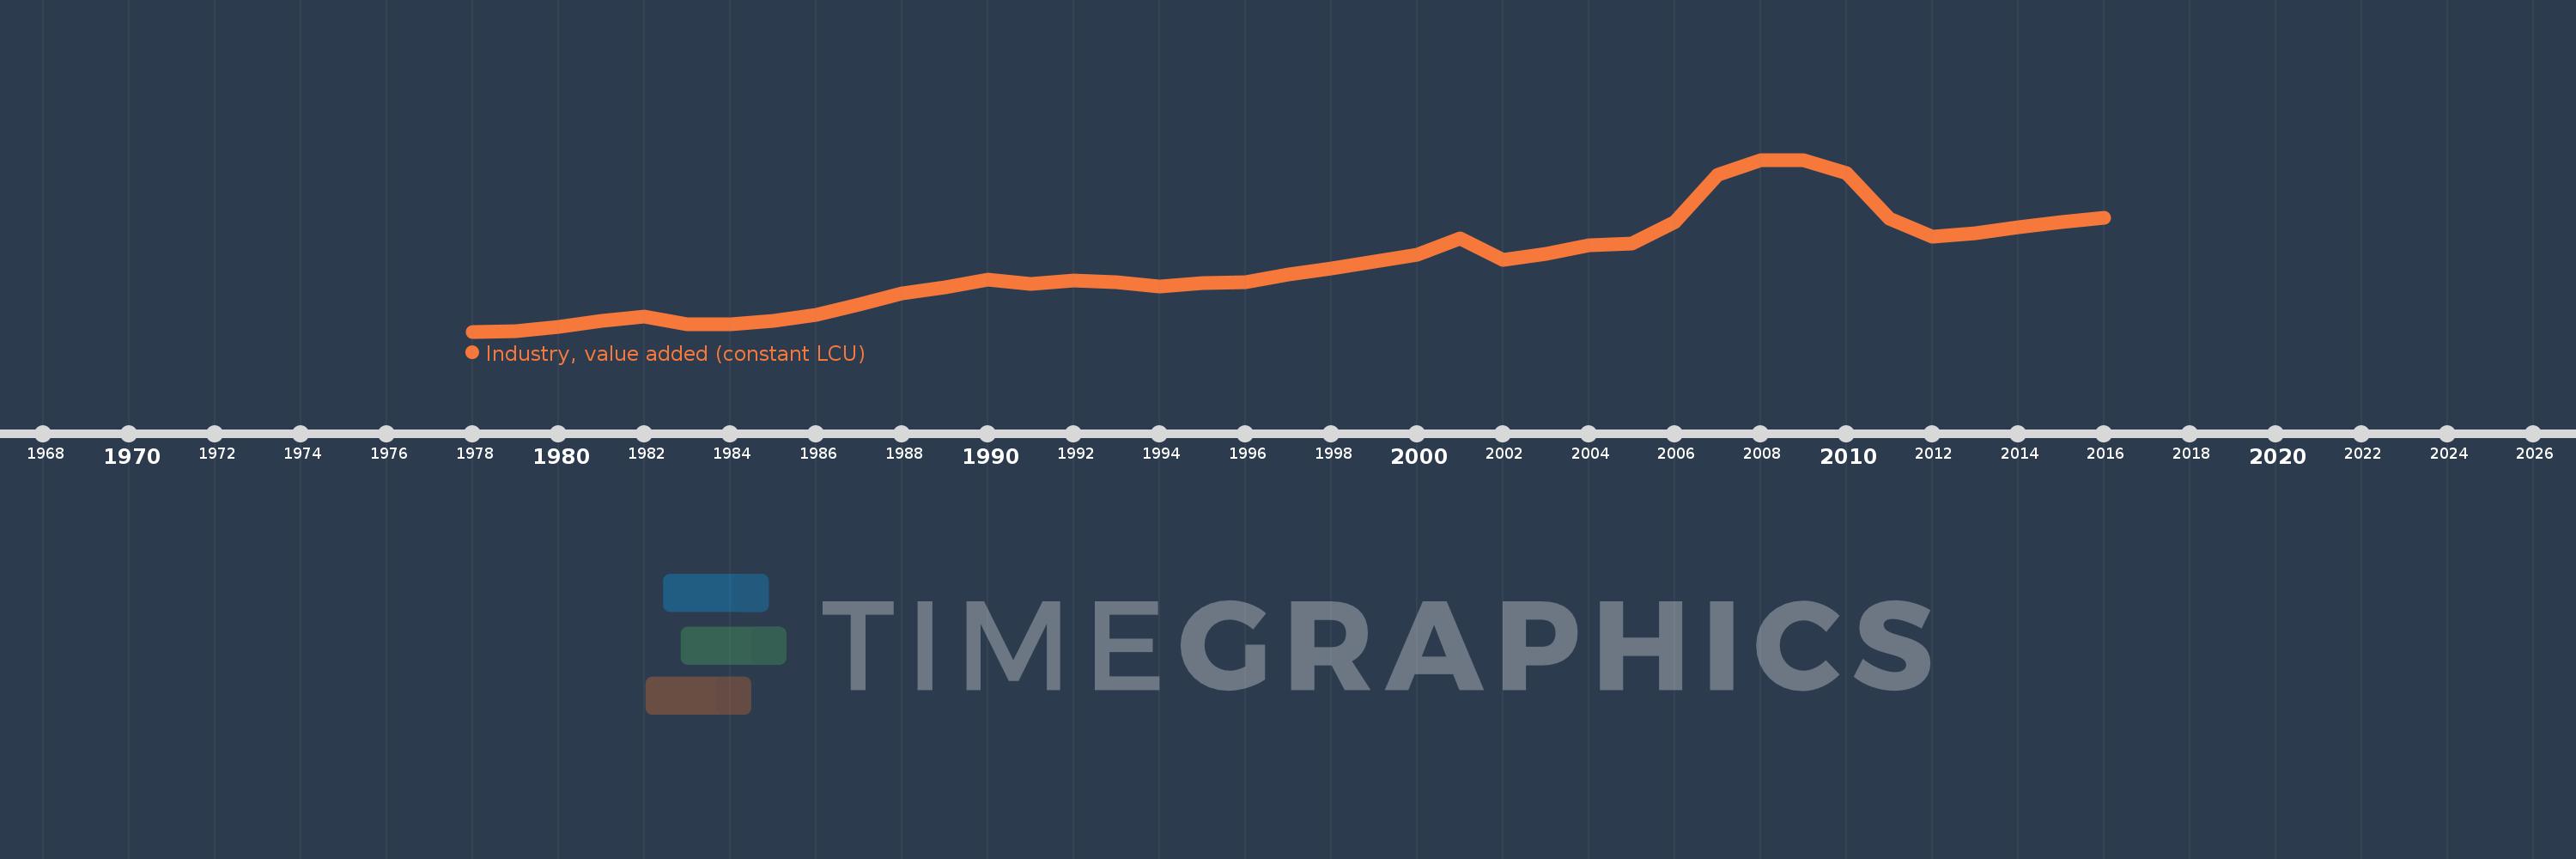
Industry, value added (constant LCU)
2016,2015,2014,2013,2012,2011,2010,2009,2008,2007,2006,2005,2004,2003,2002,2001,2000,1999,1998,1997,1996,1995,1994,1993,1992,1991,1990,1989,1988,1987,1986,1985,1984,1983,1982,1981,1980,1979,1978
This statistics in other country:
AfghanistanAlbaniaAlgeriaAntigua and BarbudaArgentinaArmeniaAustraliaAustriaAzerbaijanBahamas, TheBahrainBangladeshBelarusBelgiumBelizeBeninBermudaBhutanBoliviaBosnia and HerzegovinaBotswanaBrazilBrunei DarussalamBulgariaBurkina FasoBurundiCabo VerdeCambodiaCameroonCanadaCayman IslandsCentral African RepublicChadChileChinaColombiaComorosCongo, Dem. Rep.Congo, Rep.Costa RicaCote d'IvoireCroatiaCubaCyprusCzech RepublicDenmarkDjiboutiDominicaDominican RepublicEcuadorEgypt, Arab Rep.El SalvadorEquatorial GuineaEritreaEstoniaEthiopiaFijiFinlandFranceGabonGambia, TheGeorgiaGermanyGhanaGreeceGrenadaGuatemalaGuineaGuinea-BissauGuyanaHaitiHondurasHong Kong SAR, ChinaHungaryIcelandIndiaIndonesiaIran, Islamic Rep.IraqIrelandItalyJamaicaJapanJordanKazakhstanKenyaKiribatiKorea, Rep.KosovoKuwaitKyrgyz RepublicLao PDRLatviaLebanonLesothoLiberiaLithuaniaLuxembourgMacedonia, FYRMadagascarMalawiMalaysiaMaldivesMaliMarshall IslandsMauritaniaMauritiusMexicoMicronesia, Fed. Sts.MoldovaMongoliaMontenegroMoroccoMozambiqueMyanmarNamibiaNepalNetherlandsNew ZealandNicaraguaNigerNigeriaNorwayOmanPakistanPalauPanamaPapua New GuineaParaguayPeruPhilippinesPolandPortugalPuerto RicoQatarRomaniaRussian FederationRwandaSamoaSao Tome and PrincipeSaudi ArabiaSenegalSerbiaSeychellesSierra LeoneSingaporeSlovak RepublicSloveniaSolomon IslandsSomaliaSouth AfricaSpainSri LankaSt. Kitts and NevisSt. LuciaSt. Vincent and the GrenadinesSudanSurinameSwazilandSwedenSwitzerlandSyrian Arab RepublicTajikistanTanzaniaThailandTimor-LesteTogoTongaTrinidad and TobagoTunisiaTurkeyTurkmenistanTuvaluUgandaUkraineUnited Arab EmiratesUnited KingdomUnited StatesUruguayUzbekistanVanuatuVenezuela, RBVietnamWest Bank and GazaZambiaZimbabwe Timeline:
This timeline shows a graph from 1978 to 2016 of Antigua and Barbuda. No data until 1977. Number of actual observations by date: 39.
Source name:
World Development Indicators
Source organization:
World Bank national accounts data, and OECD National Accounts data files.
Categories, topics:
Economy & Growth
Last updated:
apr 23, 2017
Indicators value changes by year
Minimum:
72.627 mln
jan 1, 1978
Maximum:
625.656 mln
jan 1, 2009
At the date of observation
Value
Absolute change
Change from previous value
jan 1, 1978
72.627 mln
+72.627 mln
0.0%
jan 1, 1979
73.939 mln
+1.312 mln
1.81%
jan 1, 1980
89.206 mln
+15.267 mln
20.65%
jan 1, 1981
106.972 mln
+17.765 mln
19.92%
jan 1, 1982
120.611 mln
+13.64 mln
12.75%
jan 1, 1983
96.221 mln
-24.39 mln
-20.22%
jan 1, 1984
96.146 mln
-75.7K
-0.08%
jan 1, 1985
106.202 mln
+10.056 mln
10.46%
jan 1, 1986
126.415 mln
+20.213 mln
19.03%
jan 1, 1987
159.12 mln
+32.705 mln
25.87%
jan 1, 1988
196.001 mln
+36.881 mln
23.18%
jan 1, 1989
215.773 mln
+19.772 mln
10.09%
jan 1, 1990
238.699 mln
+22.926 mln
10.63%
jan 1, 1991
226.636 mln
-12.062 mln
-5.05%
jan 1, 1992
237.386 mln
+10.75 mln
4.74%
jan 1, 1993
231.532 mln
-5.854 mln
-2.47%
jan 1, 1994
217.766 mln
-13.766 mln
-5.95%
jan 1, 1995
227.507 mln
+9.741 mln
4.47%
jan 1, 1996
232.339 mln
+4.832 mln
2.12%
jan 1, 1997
257.07 mln
+24.73 mln
10.64%
jan 1, 1998
275.416 mln
+18.346 mln
7.14%
jan 1, 1999
296.764 mln
+21.349 mln
7.75%
jan 1, 2000
320.107 mln
+23.343 mln
7.87%
jan 1, 2001
371.51 mln
+51.403 mln
16.06%
jan 1, 2002
303.651 mln
-67.859 mln
-18.27%
jan 1, 2003
321.94 mln
+18.289 mln
6.02%
jan 1, 2004
349.781 mln
+27.84 mln
8.65%
jan 1, 2005
356.156 mln
+6.375 mln
1.82%
jan 1, 2006
425.813 mln
+69.658 mln
19.56%
jan 1, 2007
576.76 mln
+150.947 mln
35.45%
jan 1, 2008
623.466 mln
+46.706 mln
8.1%
jan 1, 2009
625.656 mln
+2.19 mln
0.35%
jan 1, 2010
582.987 mln
-42.669 mln
-6.82%
jan 1, 2011
435.547 mln
-147.441 mln
-25.29%
jan 1, 2012
377.92 mln
-57.627 mln
-13.23%
jan 1, 2013
388.255 mln
+10.335 mln
2.73%
jan 1, 2014
409.209 mln
+20.954 mln
5.4%
jan 1, 2015
426.24 mln
+17.031 mln
4.16%
jan 1, 2016
438.709 mln
+12.469 mln
2.93%
Ranking of countries by current statistics by years


Comments: