29
/
en
AIzaSyAYiBZKx7MnpbEhh9jyipgxe19OcubqV5w
April 1, 2024
145817
Guinea
GIN
true
2
1
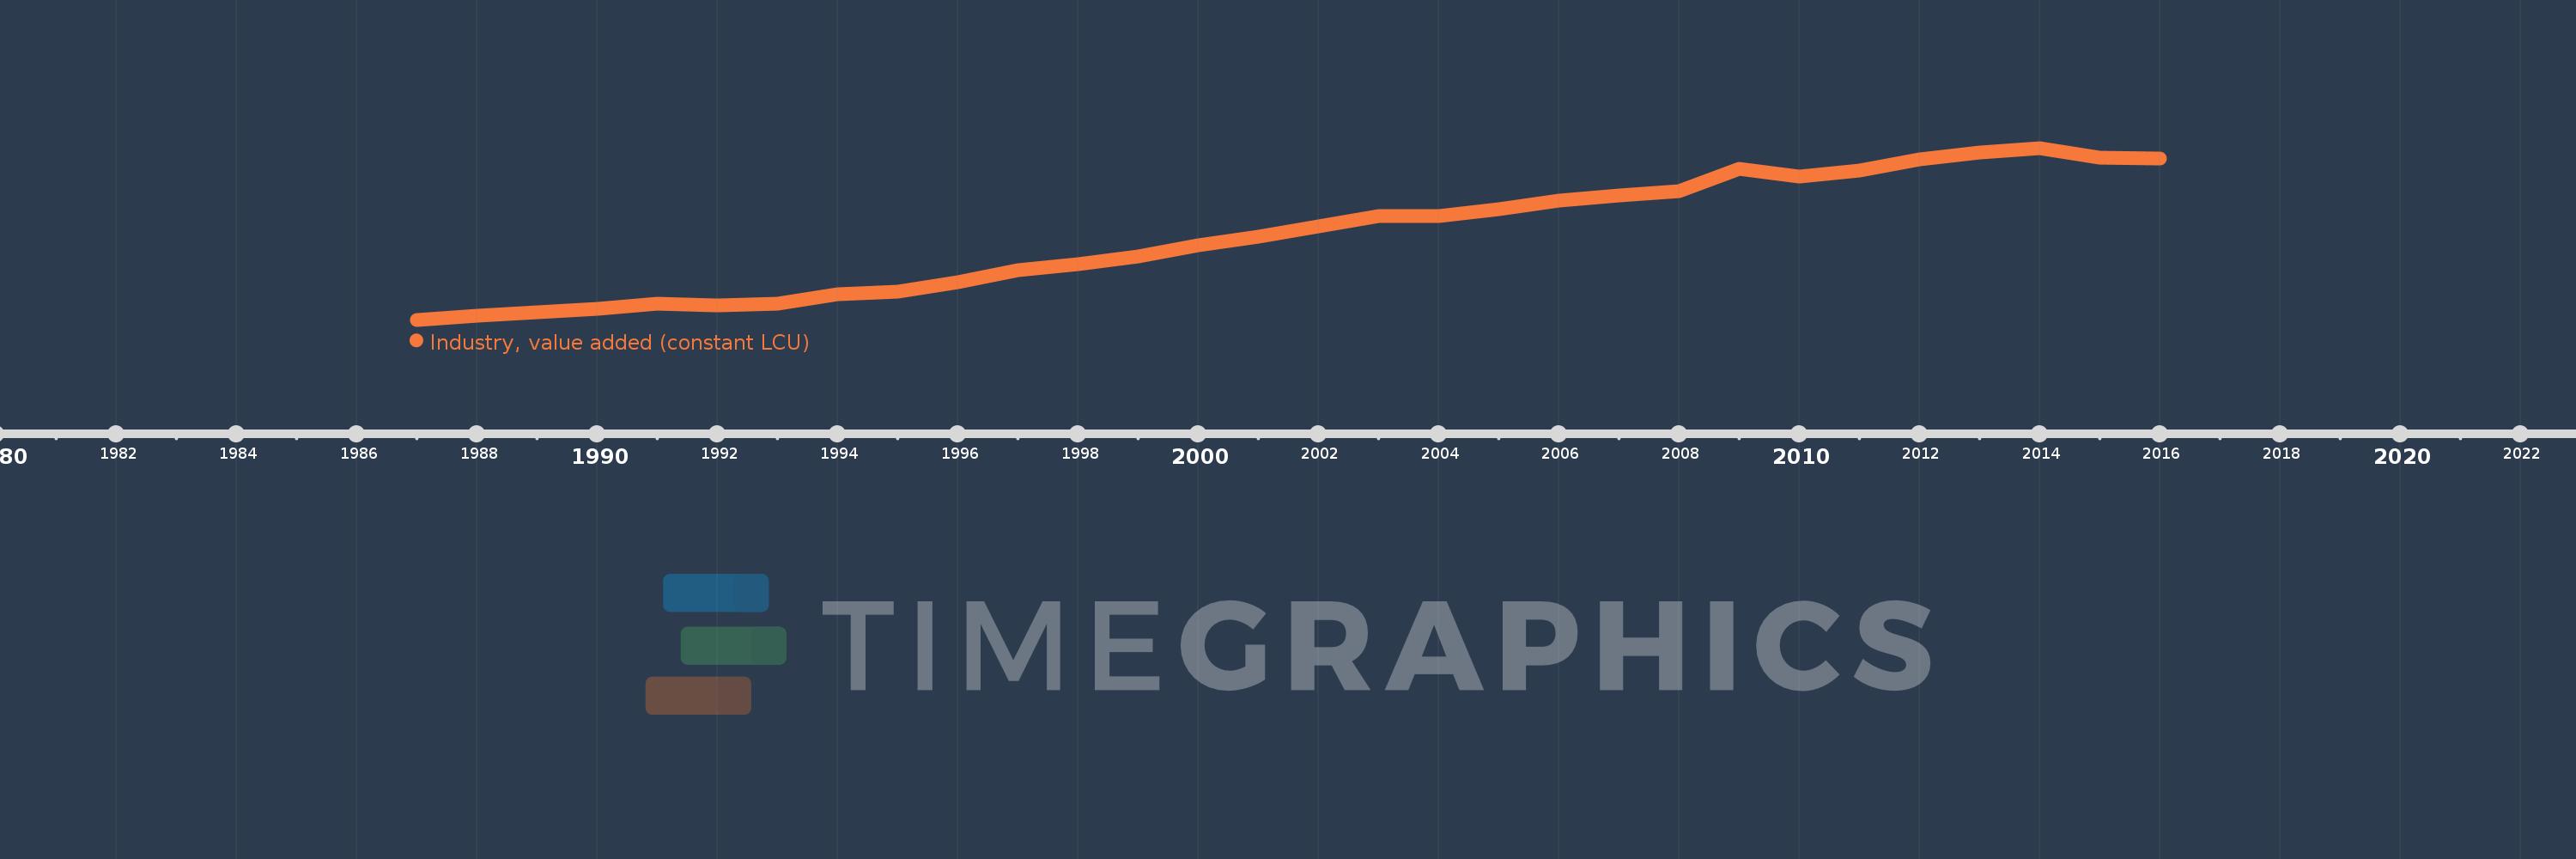
Industry, value added (constant LCU)
2016,2015,2014,2013,2012,2011,2010,2009,2008,2007,2006,2005,2004,2003,2002,2001,2000,1999,1998,1997,1996,1995,1994,1993,1992,1991,1990,1989,1988,1987
This statistics in other country:
AfghanistanAlbaniaAlgeriaAntigua and BarbudaArgentinaArmeniaAustraliaAustriaAzerbaijanBahamas, TheBahrainBangladeshBelarusBelgiumBelizeBeninBermudaBhutanBoliviaBosnia and HerzegovinaBotswanaBrazilBrunei DarussalamBulgariaBurkina FasoBurundiCabo VerdeCambodiaCameroonCanadaCayman IslandsCentral African RepublicChadChileChinaColombiaComorosCongo, Dem. Rep.Congo, Rep.Costa RicaCote d'IvoireCroatiaCubaCyprusCzech RepublicDenmarkDjiboutiDominicaDominican RepublicEcuadorEgypt, Arab Rep.El SalvadorEquatorial GuineaEritreaEstoniaEthiopiaFijiFinlandFranceGabonGambia, TheGeorgiaGermanyGhanaGreeceGrenadaGuatemalaGuineaGuinea-BissauGuyanaHaitiHondurasHong Kong SAR, ChinaHungaryIcelandIndiaIndonesiaIran, Islamic Rep.IraqIrelandItalyJamaicaJapanJordanKazakhstanKenyaKiribatiKorea, Rep.KosovoKuwaitKyrgyz RepublicLao PDRLatviaLebanonLesothoLiberiaLithuaniaLuxembourgMacedonia, FYRMadagascarMalawiMalaysiaMaldivesMaliMarshall IslandsMauritaniaMauritiusMexicoMicronesia, Fed. Sts.MoldovaMongoliaMontenegroMoroccoMozambiqueMyanmarNamibiaNepalNetherlandsNew ZealandNicaraguaNigerNigeriaNorwayOmanPakistanPalauPanamaPapua New GuineaParaguayPeruPhilippinesPolandPortugalPuerto RicoQatarRomaniaRussian FederationRwandaSamoaSao Tome and PrincipeSaudi ArabiaSenegalSerbiaSeychellesSierra LeoneSingaporeSlovak RepublicSloveniaSolomon IslandsSomaliaSouth AfricaSpainSri LankaSt. Kitts and NevisSt. LuciaSt. Vincent and the GrenadinesSudanSurinameSwazilandSwedenSwitzerlandSyrian Arab RepublicTajikistanTanzaniaThailandTimor-LesteTogoTongaTrinidad and TobagoTunisiaTurkeyTurkmenistanTuvaluUgandaUkraineUnited Arab EmiratesUnited KingdomUnited StatesUruguayUzbekistanVanuatuVenezuela, RBVietnamWest Bank and GazaZambiaZimbabwe Timeline:
This timeline shows a graph from 1987 to 2016 of Guinea. No data until 1986. Number of actual observations by date: 30.
Source name:
World Development Indicators
Source organization:
World Bank national accounts data, and OECD National Accounts data files.
Categories, topics:
Economy & Growth
Last updated:
apr 23, 2017
Indicators value changes by year
Minimum:
1.142 trl
jan 1, 1987
Maximum:
2.842 trl
jan 1, 2014
At the date of observation
Value
Absolute change
Change from previous value
jan 1, 1987
1.142 trl
+1.142 trl
0.0%
jan 1, 1988
1.179 trl
+36.911 bln
3.23%
jan 1, 1989
1.215 trl
+36.112 bln
3.06%
jan 1, 1990
1.252 trl
+37.731 bln
3.11%
jan 1, 1991
1.297 trl
+44.268 bln
3.53%
jan 1, 1992
1.285 trl
-12.024 bln
-0.93%
jan 1, 1993
1.299 trl
+14.278 bln
1.11%
jan 1, 1994
1.391 trl
+91.819 bln
7.07%
jan 1, 1995
1.417 trl
+26.508 bln
1.91%
jan 1, 1996
1.513 trl
+95.842 bln
6.76%
jan 1, 1997
1.634 trl
+120.557 bln
7.97%
jan 1, 1998
1.688 trl
+54.085 bln
3.31%
jan 1, 1999
1.769 trl
+81.668 bln
4.84%
jan 1, 2000
1.88 trl
+110.369 bln
6.24%
jan 1, 2001
1.963 trl
+82.825 bln
4.41%
jan 1, 2002
2.064 trl
+101.075 bln
5.15%
jan 1, 2003
2.168 trl
+104.766 bln
5.08%
jan 1, 2004
2.17 trl
+1.827 bln
0.08%
jan 1, 2005
2.235 trl
+64.974 bln
2.99%
jan 1, 2006
2.319 trl
+84.003 bln
3.76%
jan 1, 2007
2.372 trl
+52.807 bln
2.28%
jan 1, 2008
2.412 trl
+39.712 bln
1.67%
jan 1, 2009
2.639 trl
+227.149 bln
9.42%
jan 1, 2010
2.556 trl
-82.793 bln
-3.14%
jan 1, 2011
2.615 trl
+59.254 bln
2.32%
jan 1, 2012
2.732 trl
+116.979 bln
4.47%
jan 1, 2013
2.799 trl
+66.4 bln
2.43%
jan 1, 2014
2.842 trl
+42.9 bln
1.53%
jan 1, 2015
2.742 trl
-100.0 bln
-3.52%
jan 1, 2016
2.74 trl
-1.6 bln
-0.06%
Ranking of countries by current statistics by years


Comments: