29
/
en
AIzaSyAYiBZKx7MnpbEhh9jyipgxe19OcubqV5w
April 1, 2024
238399
Seychelles
SYC
true
2
1
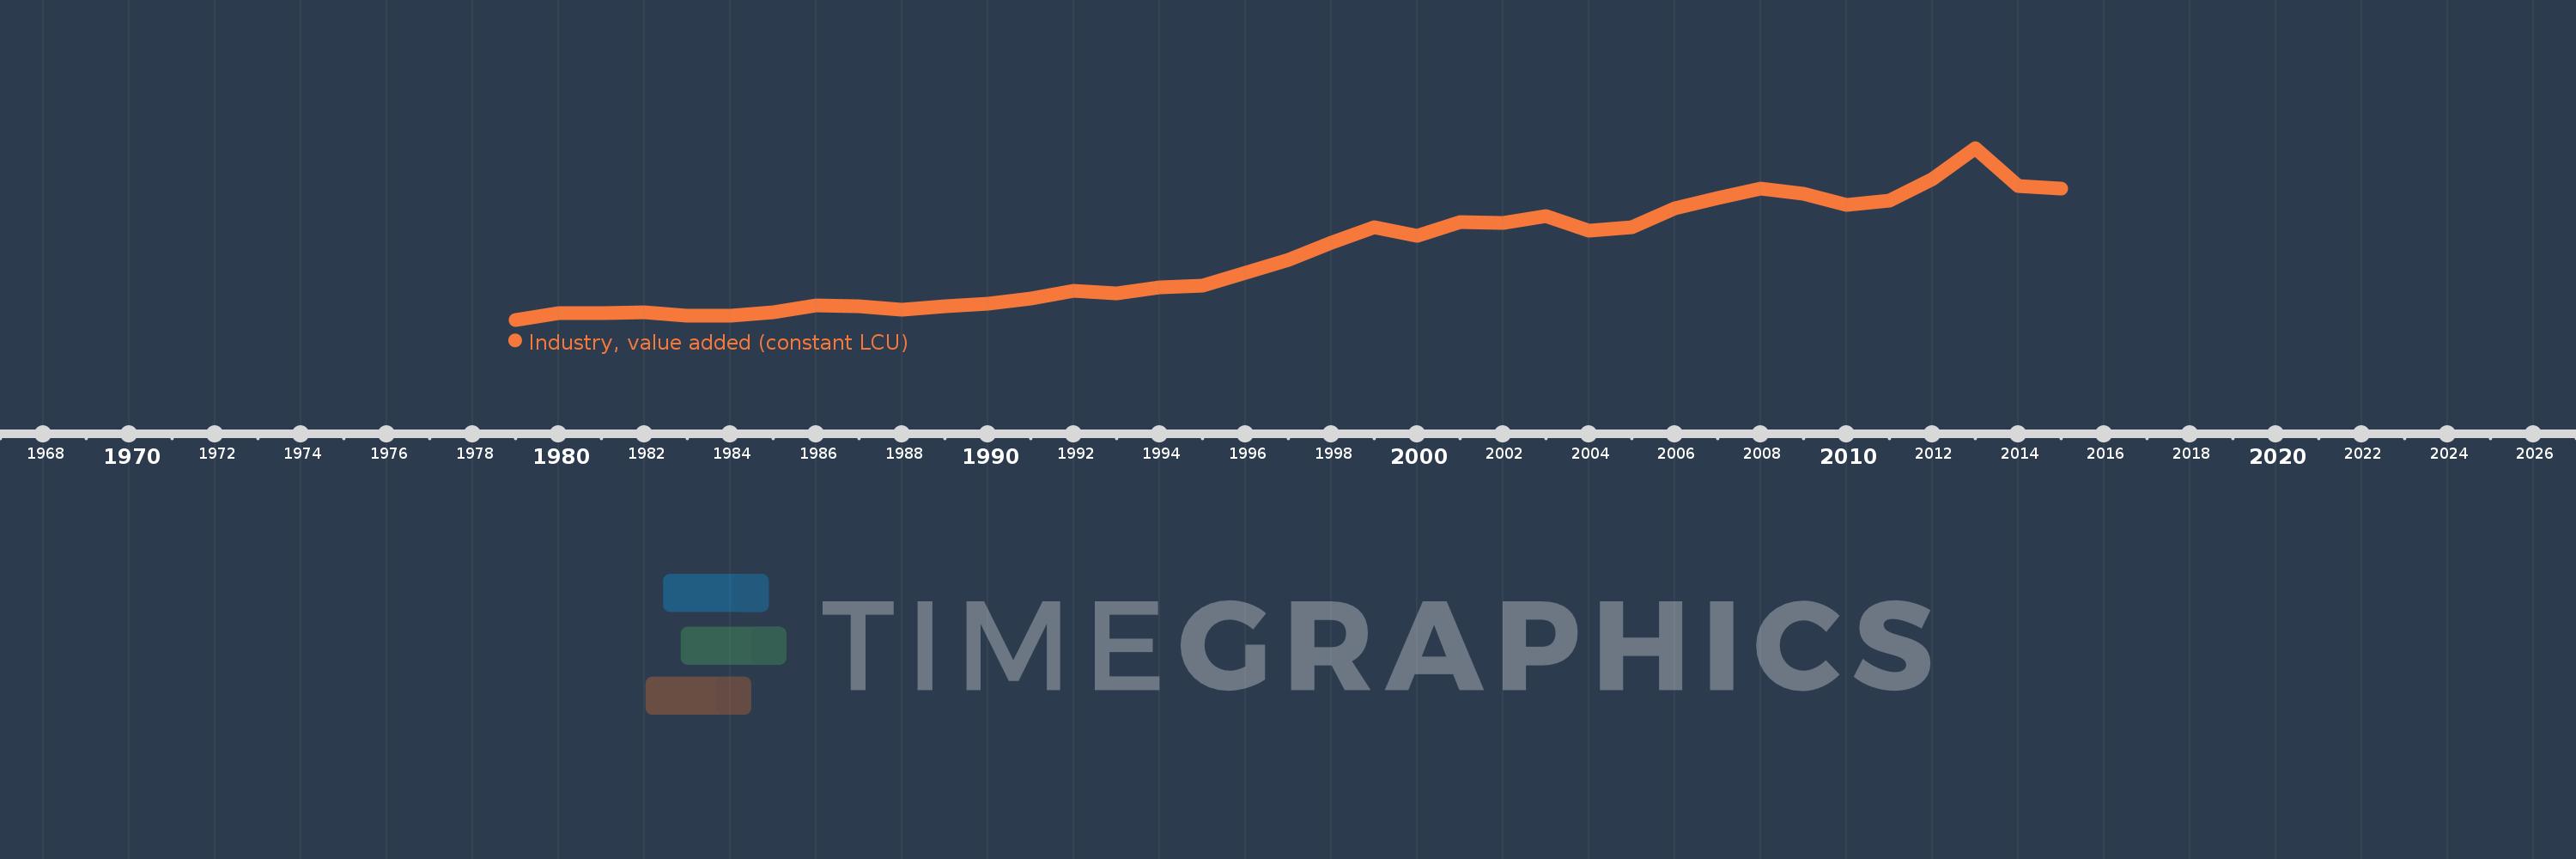
Industry, value added (constant LCU)
2015,2014,2013,2012,2011,2010,2009,2008,2007,2006,2005,2004,2003,2002,2001,2000,1999,1998,1997,1996,1995,1994,1993,1992,1991,1990,1989,1988,1987,1986,1985,1984,1983,1982,1981,1980,1979
This statistics in other country:
AfghanistanAlbaniaAlgeriaAntigua and BarbudaArgentinaArmeniaAustraliaAustriaAzerbaijanBahamas, TheBahrainBangladeshBelarusBelgiumBelizeBeninBermudaBhutanBoliviaBosnia and HerzegovinaBotswanaBrazilBrunei DarussalamBulgariaBurkina FasoBurundiCabo VerdeCambodiaCameroonCanadaCayman IslandsCentral African RepublicChadChileChinaColombiaComorosCongo, Dem. Rep.Congo, Rep.Costa RicaCote d'IvoireCroatiaCubaCyprusCzech RepublicDenmarkDjiboutiDominicaDominican RepublicEcuadorEgypt, Arab Rep.El SalvadorEquatorial GuineaEritreaEstoniaEthiopiaFijiFinlandFranceGabonGambia, TheGeorgiaGermanyGhanaGreeceGrenadaGuatemalaGuineaGuinea-BissauGuyanaHaitiHondurasHong Kong SAR, ChinaHungaryIcelandIndiaIndonesiaIran, Islamic Rep.IraqIrelandItalyJamaicaJapanJordanKazakhstanKenyaKiribatiKorea, Rep.KosovoKuwaitKyrgyz RepublicLao PDRLatviaLebanonLesothoLiberiaLithuaniaLuxembourgMacedonia, FYRMadagascarMalawiMalaysiaMaldivesMaliMarshall IslandsMauritaniaMauritiusMexicoMicronesia, Fed. Sts.MoldovaMongoliaMontenegroMoroccoMozambiqueMyanmarNamibiaNepalNetherlandsNew ZealandNicaraguaNigerNigeriaNorwayOmanPakistanPalauPanamaPapua New GuineaParaguayPeruPhilippinesPolandPortugalPuerto RicoQatarRomaniaRussian FederationRwandaSamoaSao Tome and PrincipeSaudi ArabiaSenegalSerbiaSeychellesSierra LeoneSingaporeSlovak RepublicSloveniaSolomon IslandsSomaliaSouth AfricaSpainSri LankaSt. Kitts and NevisSt. LuciaSt. Vincent and the GrenadinesSudanSurinameSwazilandSwedenSwitzerlandSyrian Arab RepublicTajikistanTanzaniaThailandTimor-LesteTogoTongaTrinidad and TobagoTunisiaTurkeyTurkmenistanTuvaluUgandaUkraineUnited Arab EmiratesUnited KingdomUnited StatesUruguayUzbekistanVanuatuVenezuela, RBVietnamWest Bank and GazaZambiaZimbabwe Timeline:
This timeline shows a graph from 1979 to 2015 of Seychelles. No data until 1978. Number of actual observations by date: 37.
Source name:
World Development Indicators
Source organization:
World Bank national accounts data, and OECD National Accounts data files.
Categories, topics:
Economy & Growth
Last updated:
apr 23, 2017
Indicators value changes by year
Minimum:
144.817 mln
jan 1, 1979
Maximum:
1.23 bln
jan 1, 2013
At the date of observation
Value
Absolute change
Change from previous value
jan 1, 1979
144.817 mln
+144.817 mln
0.0%
jan 1, 1980
184.448 mln
+39.632 mln
27.37%
jan 1, 1981
186.25 mln
+1.801 mln
0.98%
jan 1, 1982
190.453 mln
+4.203 mln
2.26%
jan 1, 1983
168.936 mln
-21.517 mln
-11.3%
jan 1, 1984
168.936 mln
0.0
0.0%
jan 1, 1985
191.054 mln
+22.118 mln
13.09%
jan 1, 1986
234.088 mln
+43.035 mln
22.52%
jan 1, 1987
229.985 mln
-4.103 mln
-1.75%
jan 1, 1988
210.77 mln
-19.215 mln
-8.36%
jan 1, 1989
230.486 mln
+19.716 mln
9.35%
jan 1, 1990
248.0 mln
+17.514 mln
7.6%
jan 1, 1991
277.223 mln
+29.224 mln
11.78%
jan 1, 1992
325.662 mln
+48.439 mln
17.47%
jan 1, 1993
310.35 mln
-15.312 mln
-4.7%
jan 1, 1994
349.882 mln
+39.532 mln
12.74%
jan 1, 1995
359.89 mln
+10.008 mln
2.86%
jan 1, 1996
441.355 mln
+81.466 mln
22.64%
jan 1, 1997
521.019 mln
+79.664 mln
18.05%
jan 1, 1998
631.408 mln
+110.389 mln
21.19%
jan 1, 1999
727.486 mln
+96.077 mln
15.22%
jan 1, 2000
675.844 mln
-51.642 mln
-7.1%
jan 1, 2001
762.158 mln
+86.314 mln
12.77%
jan 1, 2002
755.984 mln
-6.174 mln
-0.81%
jan 1, 2003
798.507 mln
+42.523 mln
5.62%
jan 1, 2004
706.414 mln
-92.093 mln
-11.53%
jan 1, 2005
729.982 mln
+23.568 mln
3.34%
jan 1, 2006
849.772 mln
+119.79 mln
16.41%
jan 1, 2007
910.986 mln
+61.214 mln
7.2%
jan 1, 2008
971.235 mln
+60.248 mln
6.61%
jan 1, 2009
940.957 mln
-30.278 mln
-3.12%
jan 1, 2010
868.581 mln
-72.376 mln
-7.69%
jan 1, 2011
898.159 mln
+29.578 mln
3.41%
jan 1, 2012
1.035 bln
+136.955 mln
15.25%
jan 1, 2013
1.23 bln
+194.66 mln
18.81%
jan 1, 2014
988.095 mln
-241.68 mln
-19.65%
jan 1, 2015
975.686 mln
-12.409 mln
-1.26%
Ranking of countries by current statistics by years


Comments: