29
/
en
AIzaSyAYiBZKx7MnpbEhh9jyipgxe19OcubqV5w
April 1, 2024
121062
Dominica
DMA
true
2
1
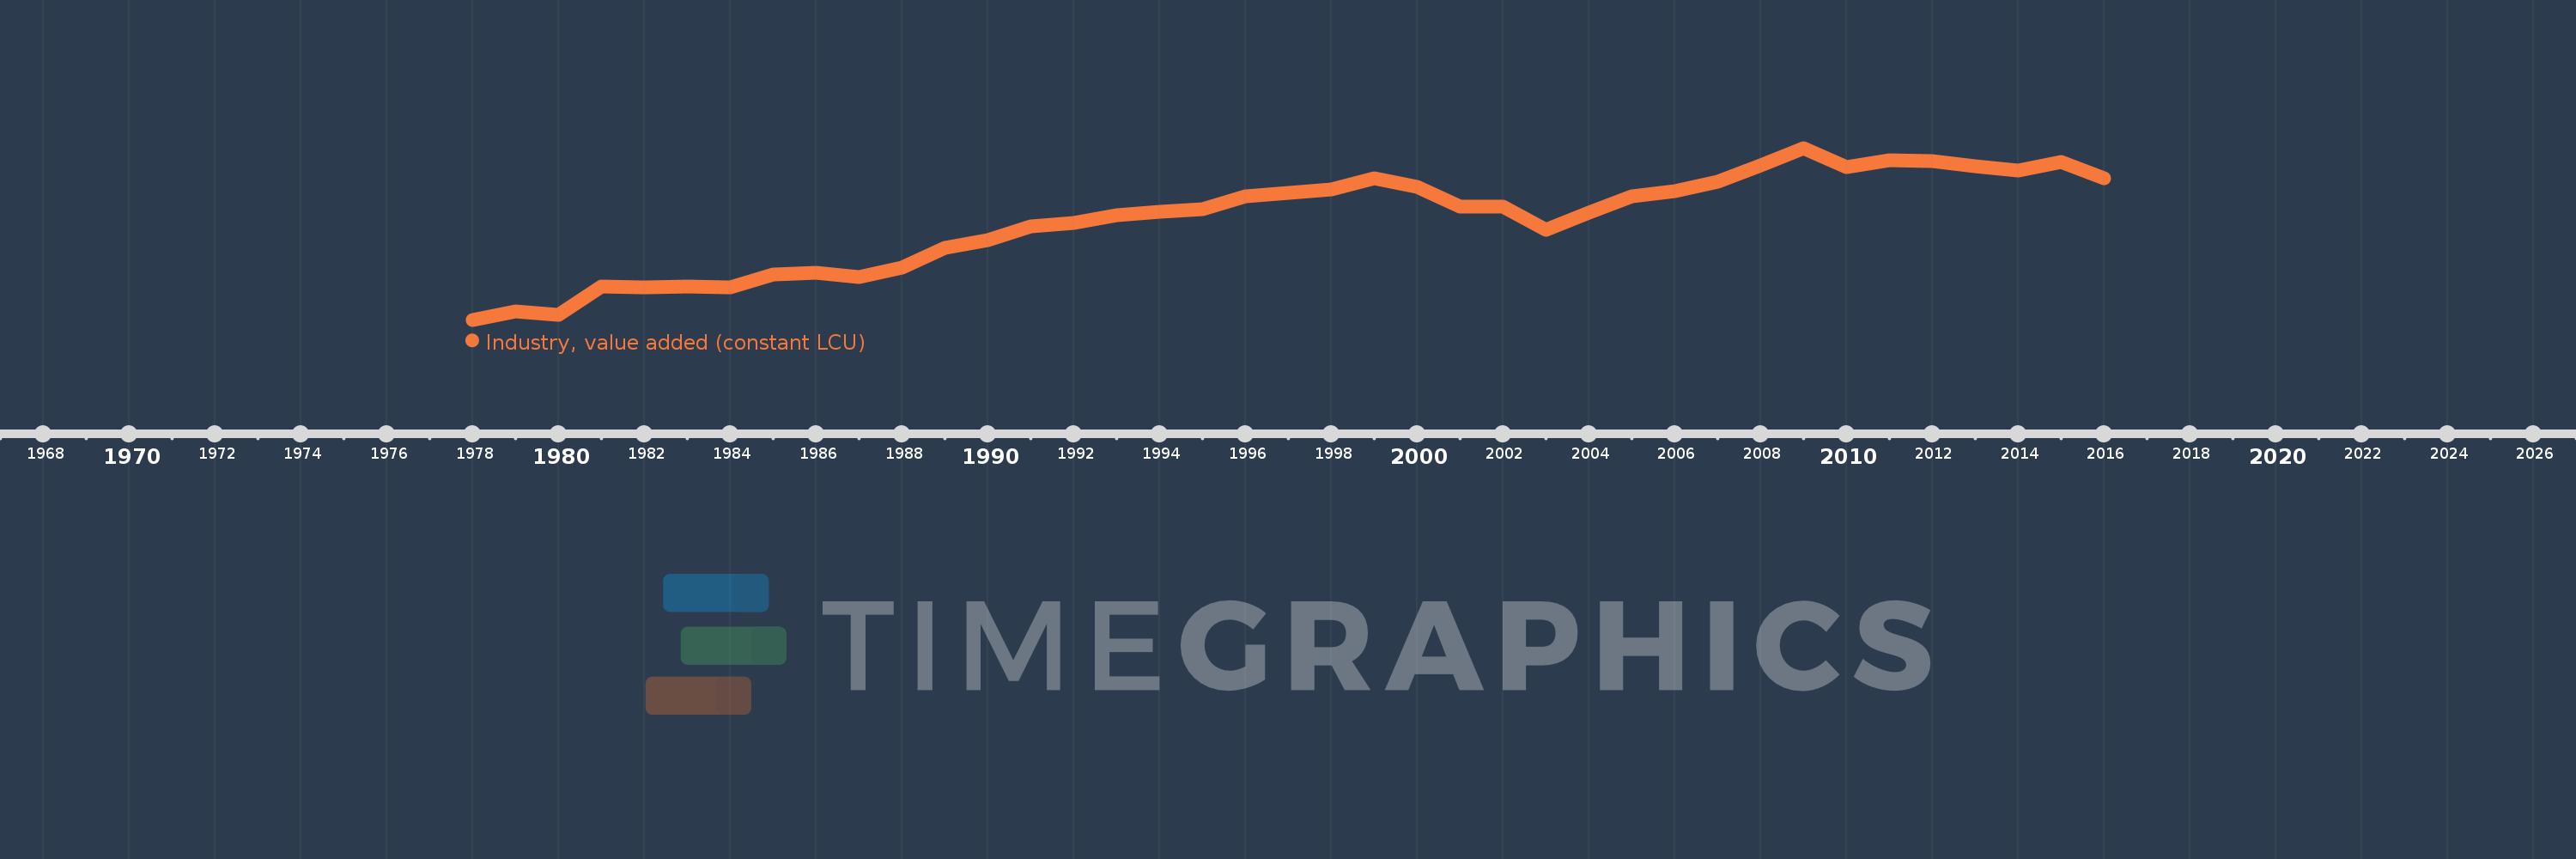
Industry, value added (constant LCU)
2016,2015,2014,2013,2012,2011,2010,2009,2008,2007,2006,2005,2004,2003,2002,2001,2000,1999,1998,1997,1996,1995,1994,1993,1992,1991,1990,1989,1988,1987,1986,1985,1984,1983,1982,1981,1980,1979,1978
This statistics in other country:
AfghanistanAlbaniaAlgeriaAntigua and BarbudaArgentinaArmeniaAustraliaAustriaAzerbaijanBahamas, TheBahrainBangladeshBelarusBelgiumBelizeBeninBermudaBhutanBoliviaBosnia and HerzegovinaBotswanaBrazilBrunei DarussalamBulgariaBurkina FasoBurundiCabo VerdeCambodiaCameroonCanadaCayman IslandsCentral African RepublicChadChileChinaColombiaComorosCongo, Dem. Rep.Congo, Rep.Costa RicaCote d'IvoireCroatiaCubaCyprusCzech RepublicDenmarkDjiboutiDominicaDominican RepublicEcuadorEgypt, Arab Rep.El SalvadorEquatorial GuineaEritreaEstoniaEthiopiaFijiFinlandFranceGabonGambia, TheGeorgiaGermanyGhanaGreeceGrenadaGuatemalaGuineaGuinea-BissauGuyanaHaitiHondurasHong Kong SAR, ChinaHungaryIcelandIndiaIndonesiaIran, Islamic Rep.IraqIrelandItalyJamaicaJapanJordanKazakhstanKenyaKiribatiKorea, Rep.KosovoKuwaitKyrgyz RepublicLao PDRLatviaLebanonLesothoLiberiaLithuaniaLuxembourgMacedonia, FYRMadagascarMalawiMalaysiaMaldivesMaliMarshall IslandsMauritaniaMauritiusMexicoMicronesia, Fed. Sts.MoldovaMongoliaMontenegroMoroccoMozambiqueMyanmarNamibiaNepalNetherlandsNew ZealandNicaraguaNigerNigeriaNorwayOmanPakistanPalauPanamaPapua New GuineaParaguayPeruPhilippinesPolandPortugalPuerto RicoQatarRomaniaRussian FederationRwandaSamoaSao Tome and PrincipeSaudi ArabiaSenegalSerbiaSeychellesSierra LeoneSingaporeSlovak RepublicSloveniaSolomon IslandsSomaliaSouth AfricaSpainSri LankaSt. Kitts and NevisSt. LuciaSt. Vincent and the GrenadinesSudanSurinameSwazilandSwedenSwitzerlandSyrian Arab RepublicTajikistanTanzaniaThailandTimor-LesteTogoTongaTrinidad and TobagoTunisiaTurkeyTurkmenistanTuvaluUgandaUkraineUnited Arab EmiratesUnited KingdomUnited StatesUruguayUzbekistanVanuatuVenezuela, RBVietnamWest Bank and GazaZambiaZimbabwe Timeline:
This timeline shows a graph from 1978 to 2016 of Dominica. No data until 1977. Number of actual observations by date: 39.
Source name:
World Development Indicators
Source organization:
World Bank national accounts data, and OECD National Accounts data files.
Categories, topics:
Economy & Growth
Last updated:
apr 23, 2017
Indicators value changes by year
Minimum:
42.038 mln
jan 1, 1978
Maximum:
162.176 mln
jan 1, 2009
At the date of observation
Value
Absolute change
Change from previous value
jan 1, 1978
42.038 mln
+42.038 mln
0.0%
jan 1, 1979
48.153 mln
+6.114 mln
14.54%
jan 1, 1980
45.679 mln
-2.474 mln
-5.14%
jan 1, 1981
65.111 mln
+19.432 mln
42.54%
jan 1, 1982
64.629 mln
-482.3K
-0.74%
jan 1, 1983
65.034 mln
+404.5K
0.63%
jan 1, 1984
64.847 mln
-186.7K
-0.29%
jan 1, 1985
73.777 mln
+8.931 mln
13.77%
jan 1, 1986
74.695 mln
+917.9K
1.24%
jan 1, 1987
72.05 mln
-2.645 mln
-3.54%
jan 1, 1988
78.429 mln
+6.379 mln
8.85%
jan 1, 1989
92.105 mln
+13.676 mln
17.44%
jan 1, 1990
97.659 mln
+5.554 mln
6.03%
jan 1, 1991
107.119 mln
+9.46 mln
9.69%
jan 1, 1992
110.013 mln
+2.894 mln
2.7%
jan 1, 1993
115.396 mln
+5.383 mln
4.89%
jan 1, 1994
117.387 mln
+1.991 mln
1.73%
jan 1, 1995
119.192 mln
+1.805 mln
1.54%
jan 1, 1996
128.589 mln
+9.397 mln
7.88%
jan 1, 1997
130.985 mln
+2.396 mln
1.86%
jan 1, 1998
133.21 mln
+2.225 mln
1.7%
jan 1, 1999
140.725 mln
+7.515 mln
5.64%
jan 1, 2000
134.875 mln
-5.85 mln
-4.16%
jan 1, 2001
121.424 mln
-13.45 mln
-9.97%
jan 1, 2002
120.922 mln
-501.8K
-0.41%
jan 1, 2003
104.646 mln
-16.276 mln
-13.46%
jan 1, 2004
117.143 mln
+12.496 mln
11.94%
jan 1, 2005
128.203 mln
+11.061 mln
9.44%
jan 1, 2006
132.0 mln
+3.796 mln
2.96%
jan 1, 2007
138.678 mln
+6.678 mln
5.06%
jan 1, 2008
150.079 mln
+11.401 mln
8.22%
jan 1, 2009
162.176 mln
+12.096 mln
8.06%
jan 1, 2010
149.046 mln
-13.13 mln
-8.1%
jan 1, 2011
153.332 mln
+4.286 mln
2.88%
jan 1, 2012
153.188 mln
-143.9K
-0.09%
jan 1, 2013
149.344 mln
-3.844 mln
-2.51%
jan 1, 2014
146.349 mln
-2.995 mln
-2.01%
jan 1, 2015
152.37 mln
+6.02 mln
4.11%
jan 1, 2016
140.933 mln
-11.436 mln
-7.51%
Ranking of countries by current statistics by years


Comments: