29
/
en
AIzaSyAYiBZKx7MnpbEhh9jyipgxe19OcubqV5w
April 1, 2024
249990
St. Kitts and Nevis
KNA
true
2
1
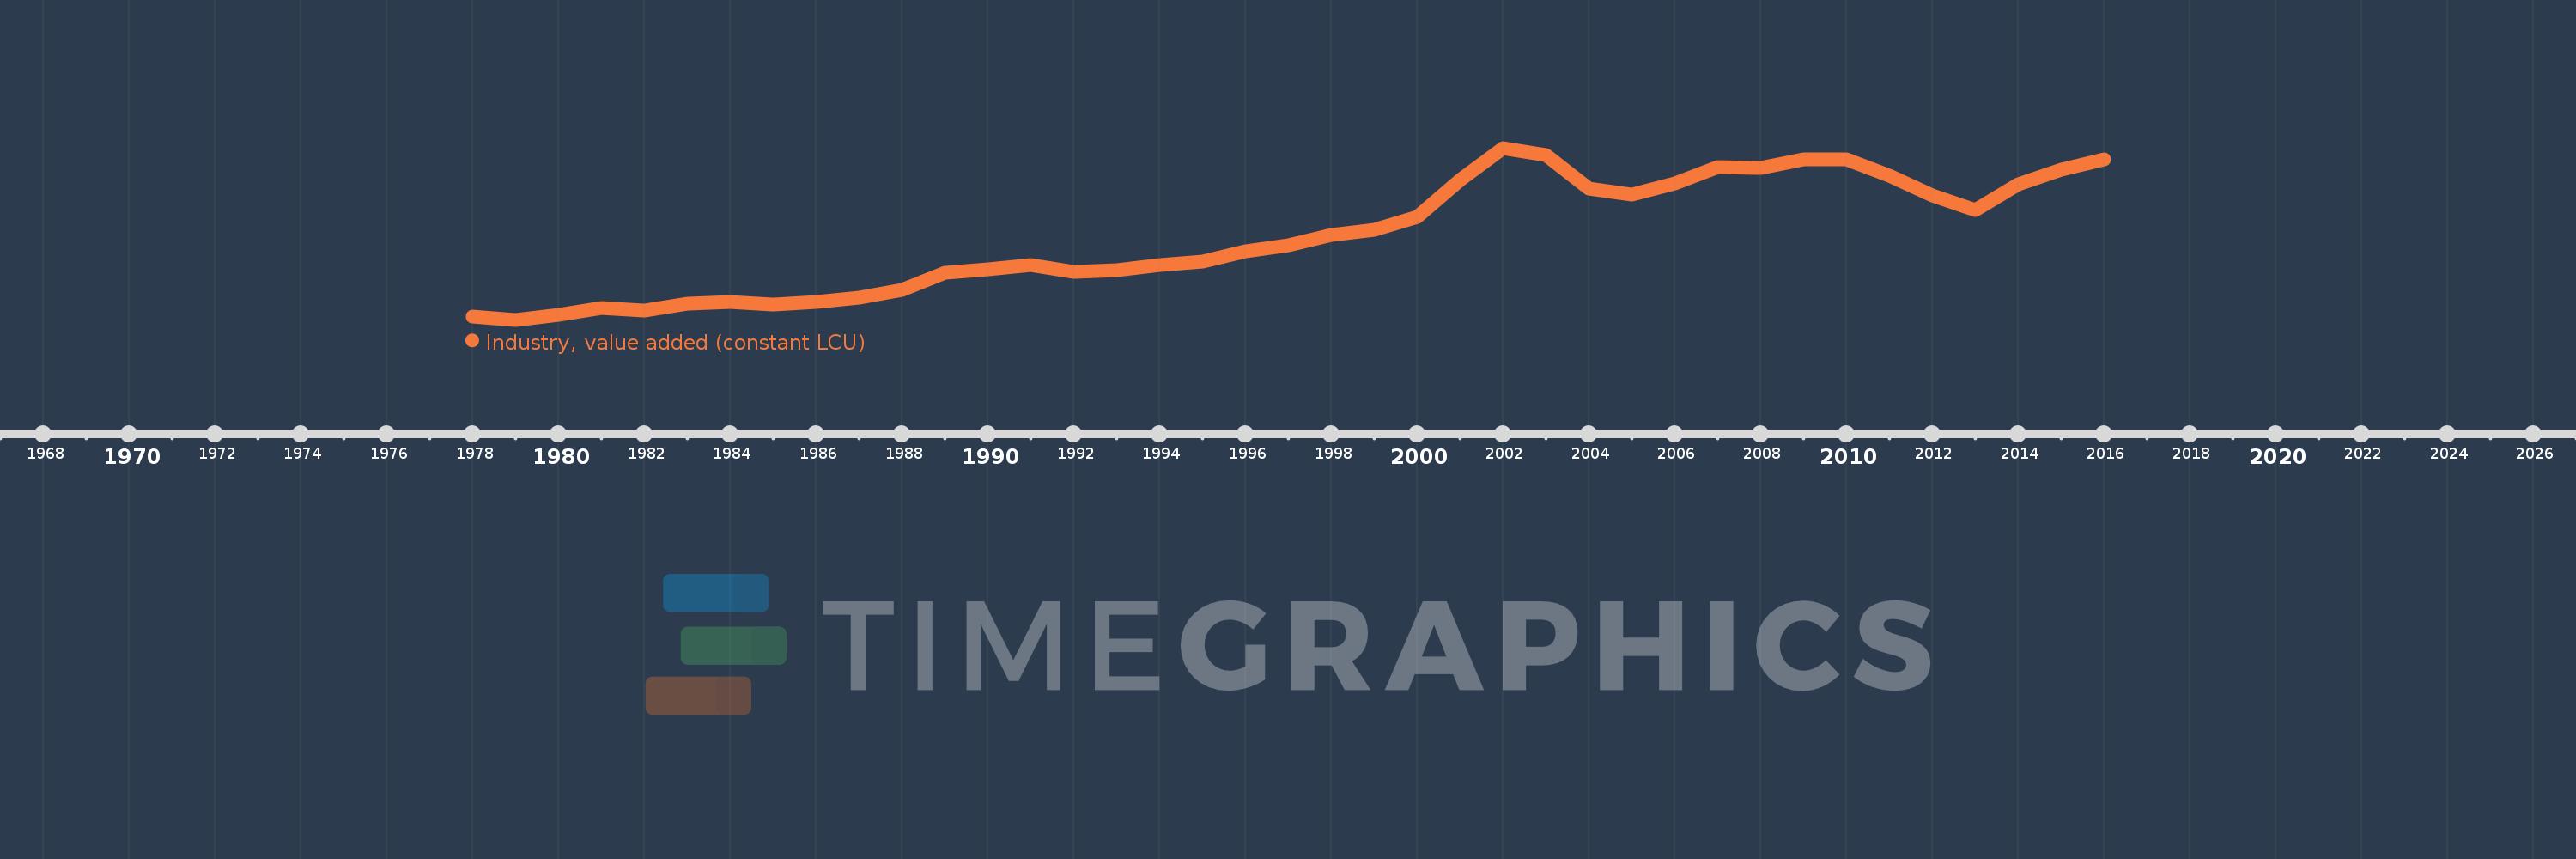
Industry, value added (constant LCU)
2016,2015,2014,2013,2012,2011,2010,2009,2008,2007,2006,2005,2004,2003,2002,2001,2000,1999,1998,1997,1996,1995,1994,1993,1992,1991,1990,1989,1988,1987,1986,1985,1984,1983,1982,1981,1980,1979,1978
This statistics in other country:
AfghanistanAlbaniaAlgeriaAntigua and BarbudaArgentinaArmeniaAustraliaAustriaAzerbaijanBahamas, TheBahrainBangladeshBelarusBelgiumBelizeBeninBermudaBhutanBoliviaBosnia and HerzegovinaBotswanaBrazilBrunei DarussalamBulgariaBurkina FasoBurundiCabo VerdeCambodiaCameroonCanadaCayman IslandsCentral African RepublicChadChileChinaColombiaComorosCongo, Dem. Rep.Congo, Rep.Costa RicaCote d'IvoireCroatiaCubaCyprusCzech RepublicDenmarkDjiboutiDominicaDominican RepublicEcuadorEgypt, Arab Rep.El SalvadorEquatorial GuineaEritreaEstoniaEthiopiaFijiFinlandFranceGabonGambia, TheGeorgiaGermanyGhanaGreeceGrenadaGuatemalaGuineaGuinea-BissauGuyanaHaitiHondurasHong Kong SAR, ChinaHungaryIcelandIndiaIndonesiaIran, Islamic Rep.IraqIrelandItalyJamaicaJapanJordanKazakhstanKenyaKiribatiKorea, Rep.KosovoKuwaitKyrgyz RepublicLao PDRLatviaLebanonLesothoLiberiaLithuaniaLuxembourgMacedonia, FYRMadagascarMalawiMalaysiaMaldivesMaliMarshall IslandsMauritaniaMauritiusMexicoMicronesia, Fed. Sts.MoldovaMongoliaMontenegroMoroccoMozambiqueMyanmarNamibiaNepalNetherlandsNew ZealandNicaraguaNigerNigeriaNorwayOmanPakistanPalauPanamaPapua New GuineaParaguayPeruPhilippinesPolandPortugalPuerto RicoQatarRomaniaRussian FederationRwandaSamoaSao Tome and PrincipeSaudi ArabiaSenegalSerbiaSeychellesSierra LeoneSingaporeSlovak RepublicSloveniaSolomon IslandsSomaliaSouth AfricaSpainSri LankaSt. Kitts and NevisSt. LuciaSt. Vincent and the GrenadinesSudanSurinameSwazilandSwedenSwitzerlandSyrian Arab RepublicTajikistanTanzaniaThailandTimor-LesteTogoTongaTrinidad and TobagoTunisiaTurkeyTurkmenistanTuvaluUgandaUkraineUnited Arab EmiratesUnited KingdomUnited StatesUruguayUzbekistanVanuatuVenezuela, RBVietnamWest Bank and GazaZambiaZimbabwe Timeline:
This timeline shows a graph from 1978 to 2016 of St. Kitts and Nevis. No data until 1977. Number of actual observations by date: 39.
Source name:
World Development Indicators
Source organization:
World Bank national accounts data, and OECD National Accounts data files.
Categories, topics:
Economy & Growth
Last updated:
apr 23, 2017
Indicators value changes by year
Minimum:
92.551 mln
jan 1, 1979
Maximum:
440.92 mln
jan 1, 2002
At the date of observation
Value
Absolute change
Change from previous value
jan 1, 1978
99.186 mln
+99.186 mln
0.0%
jan 1, 1979
92.551 mln
-6.635 mln
-6.69%
jan 1, 1980
101.741 mln
+9.191 mln
9.93%
jan 1, 1981
116.318 mln
+14.577 mln
14.33%
jan 1, 1982
111.215 mln
-5.104 mln
-4.39%
jan 1, 1983
125.88 mln
+14.665 mln
13.19%
jan 1, 1984
127.962 mln
+2.082 mln
1.65%
jan 1, 1985
123.471 mln
-4.491 mln
-3.51%
jan 1, 1986
128.864 mln
+5.393 mln
4.37%
jan 1, 1987
137.22 mln
+8.357 mln
6.48%
jan 1, 1988
152.964 mln
+15.743 mln
11.47%
jan 1, 1989
187.025 mln
+34.062 mln
22.27%
jan 1, 1990
195.115 mln
+8.09 mln
4.33%
jan 1, 1991
203.065 mln
+7.95 mln
4.07%
jan 1, 1992
189.156 mln
-13.909 mln
-6.85%
jan 1, 1993
192.395 mln
+3.239 mln
1.71%
jan 1, 1994
203.559 mln
+11.164 mln
5.8%
jan 1, 1995
209.66 mln
+6.101 mln
3.0%
jan 1, 1996
231.714 mln
+22.055 mln
10.52%
jan 1, 1997
243.144 mln
+11.43 mln
4.93%
jan 1, 1998
264.401 mln
+21.257 mln
8.74%
jan 1, 1999
274.961 mln
+10.56 mln
3.99%
jan 1, 2000
301.842 mln
+26.881 mln
9.78%
jan 1, 2001
375.93 mln
+74.088 mln
24.55%
jan 1, 2002
440.92 mln
+64.99 mln
17.29%
jan 1, 2003
425.817 mln
-15.103 mln
-3.43%
jan 1, 2004
358.543 mln
-67.274 mln
-15.8%
jan 1, 2005
345.494 mln
-13.049 mln
-3.64%
jan 1, 2006
369.08 mln
+23.586 mln
6.83%
jan 1, 2007
402.821 mln
+33.742 mln
9.14%
jan 1, 2008
400.692 mln
-2.129 mln
-0.53%
jan 1, 2009
417.517 mln
+16.824 mln
4.2%
jan 1, 2010
417.26 mln
-256.8K
-0.06%
jan 1, 2011
384.176 mln
-33.084 mln
-7.93%
jan 1, 2012
344.371 mln
-39.805 mln
-10.36%
jan 1, 2013
314.591 mln
-29.78 mln
-8.65%
jan 1, 2014
366.627 mln
+52.036 mln
16.54%
jan 1, 2015
397.074 mln
+30.447 mln
8.3%
jan 1, 2016
418.204 mln
+21.13 mln
5.32%
Ranking of countries by current statistics by years


Comments: