29
/
en
AIzaSyAYiBZKx7MnpbEhh9jyipgxe19OcubqV5w
April 1, 2024
87039
Bolivia
BOL
true
2
1
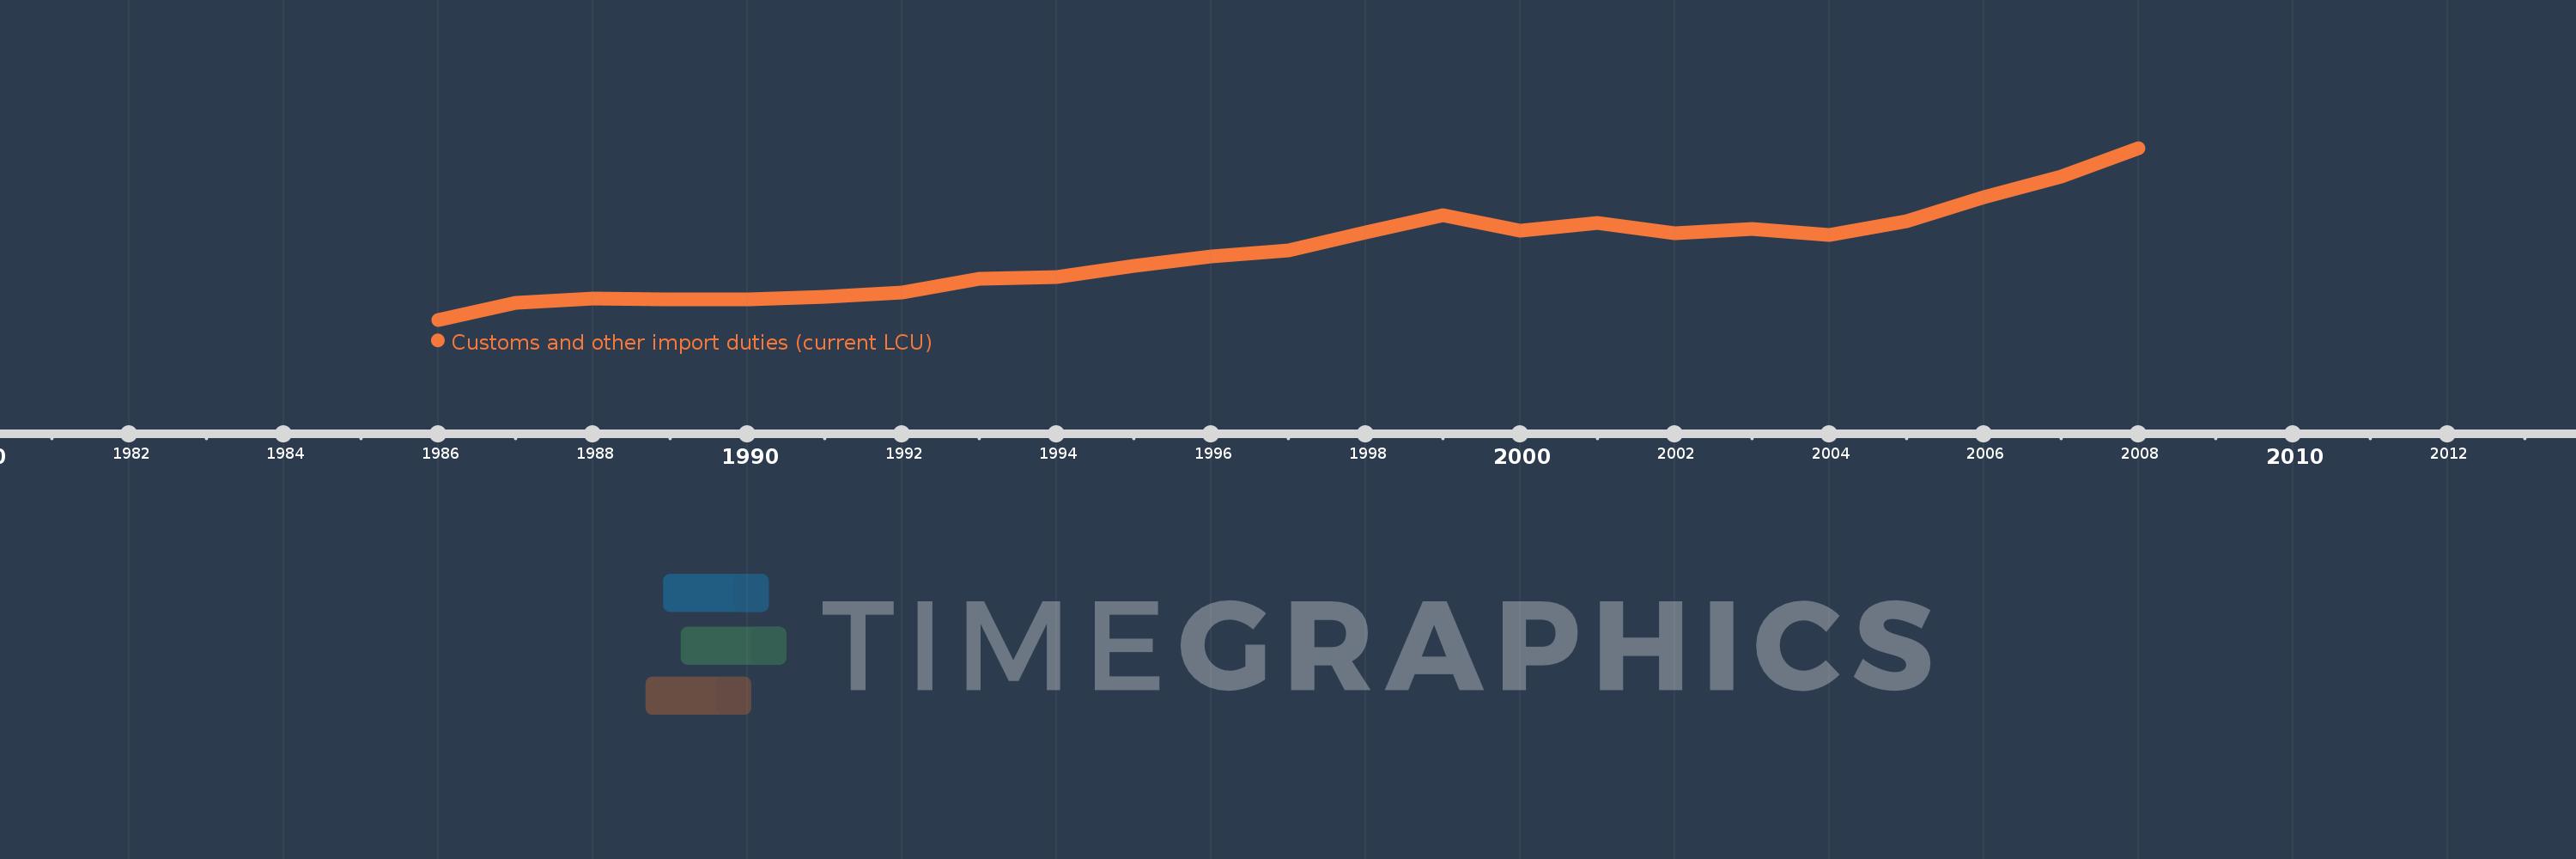
Customs and other import duties (current LCU)
2008,2007,2006,2005,2004,2003,2002,2001,2000,1999,1998,1997,1996,1995,1994,1993,1992,1991,1990,1989,1988,1987,1986
This statistics in other country:
AfghanistanAlbaniaAlgeriaAngolaAntigua and BarbudaArgentinaArmeniaAustraliaAustriaAzerbaijanBahamas, TheBahrainBangladeshBarbadosBelarusBelizeBeninBhutanBoliviaBosnia and HerzegovinaBotswanaBrazilBulgariaBurkina FasoBurundiCabo VerdeCambodiaCentral African RepublicChileChinaColombiaCongo, Dem. Rep.Congo, Rep.Costa RicaCote d'IvoireCroatiaCyprusCzech RepublicDenmarkDominicaDominican RepublicEgypt, Arab Rep.El SalvadorEquatorial GuineaEstoniaEthiopiaFijiFinlandFranceGambia, TheGeorgiaGermanyGhanaGreeceGrenadaGuatemalaHondurasHong Kong SAR, ChinaHungaryIcelandIndiaIndonesiaIran, Islamic Rep.IraqIrelandIsraelItalyJamaicaJapanJordanKazakhstanKenyaKiribatiKorea, Rep.KuwaitKyrgyz RepublicLao PDRLatviaLebanonLiberiaLithuaniaLuxembourgMacedonia, FYRMadagascarMalawiMalaysiaMaldivesMaliMaltaMauritiusMexicoMicronesia, Fed. Sts.MoldovaMongoliaMoroccoMozambiqueMyanmarNamibiaNepalNetherlandsNew ZealandNicaraguaNorwayOmanPakistanPanamaPapua New GuineaParaguayPeruPhilippinesPolandPortugalQatarRomaniaRussian FederationRwandaSamoaSan MarinoSao Tome and PrincipeSenegalSerbiaSeychellesSierra LeoneSingaporeSlovak RepublicSloveniaSolomon IslandsSouth AfricaSpainSri LankaSt. Kitts and NevisSt. LuciaSurinameSwazilandSwedenSwitzerlandSyrian Arab RepublicTajikistanTanzaniaThailandTogoTrinidad and TobagoTunisiaTurkeyUgandaUkraineUnited Arab EmiratesUnited KingdomUnited StatesUruguayVanuatuVenezuela, RBVietnamWest Bank and GazaYemen, Rep.ZambiaZimbabwe Timeline:
This timeline shows a graph from 1986 to 2008 of Bolivia. No data until 1985. Number of actual observations by date: 23.
Source name:
World Development Indicators
Source organization:
International Monetary Fund, Government Finance Statistics Yearbook and data files.
Categories, topics:
Public Sector
Last updated:
apr 23, 2017
Indicators value changes by year
Minimum:
30.2 mln
jan 1, 1986
Maximum:
895.628 mln
jan 1, 2008
At the date of observation
Value
Absolute change
Change from previous value
jan 1, 1986
30.2 mln
+30.2 mln
0.0%
jan 1, 1987
114.2 mln
+84.0 mln
278.15%
jan 1, 1988
135.6 mln
+21.4 mln
18.74%
jan 1, 1989
133.8 mln
-1.8 mln
-1.33%
jan 1, 1990
131.3 mln
-2.5 mln
-1.87%
jan 1, 1991
145.3 mln
+14.0 mln
10.66%
jan 1, 1992
169.1 mln
+23.8 mln
16.38%
jan 1, 1993
234.6 mln
+65.5 mln
38.73%
jan 1, 1994
244.5 mln
+9.9 mln
4.22%
jan 1, 1995
301.5 mln
+57.0 mln
23.31%
jan 1, 1996
349.8 mln
+48.3 mln
16.02%
jan 1, 1997
377.9 mln
+28.1 mln
8.03%
jan 1, 1998
472.0 mln
+94.1 mln
24.9%
jan 1, 1999
556.7 mln
+84.7 mln
17.94%
jan 1, 2000
480.7 mln
-76.0 mln
-13.65%
jan 1, 2001
519.7 mln
+39.0 mln
8.11%
jan 1, 2002
465.08 mln
-54.62 mln
-10.51%
jan 1, 2003
488.221 mln
+23.141 mln
4.98%
jan 1, 2004
455.179 mln
-33.042 mln
-6.77%
jan 1, 2005
528.3 mln
+73.121 mln
16.06%
jan 1, 2006
648.448 mln
+120.148 mln
22.74%
jan 1, 2007
750.304 mln
+101.856 mln
15.71%
jan 1, 2008
895.628 mln
+145.323 mln
19.37%
Ranking of countries by current statistics by years


Comments: