29
/
en
AIzaSyAYiBZKx7MnpbEhh9jyipgxe19OcubqV5w
April 1, 2024
161323
Italy
ITA
true
2
1
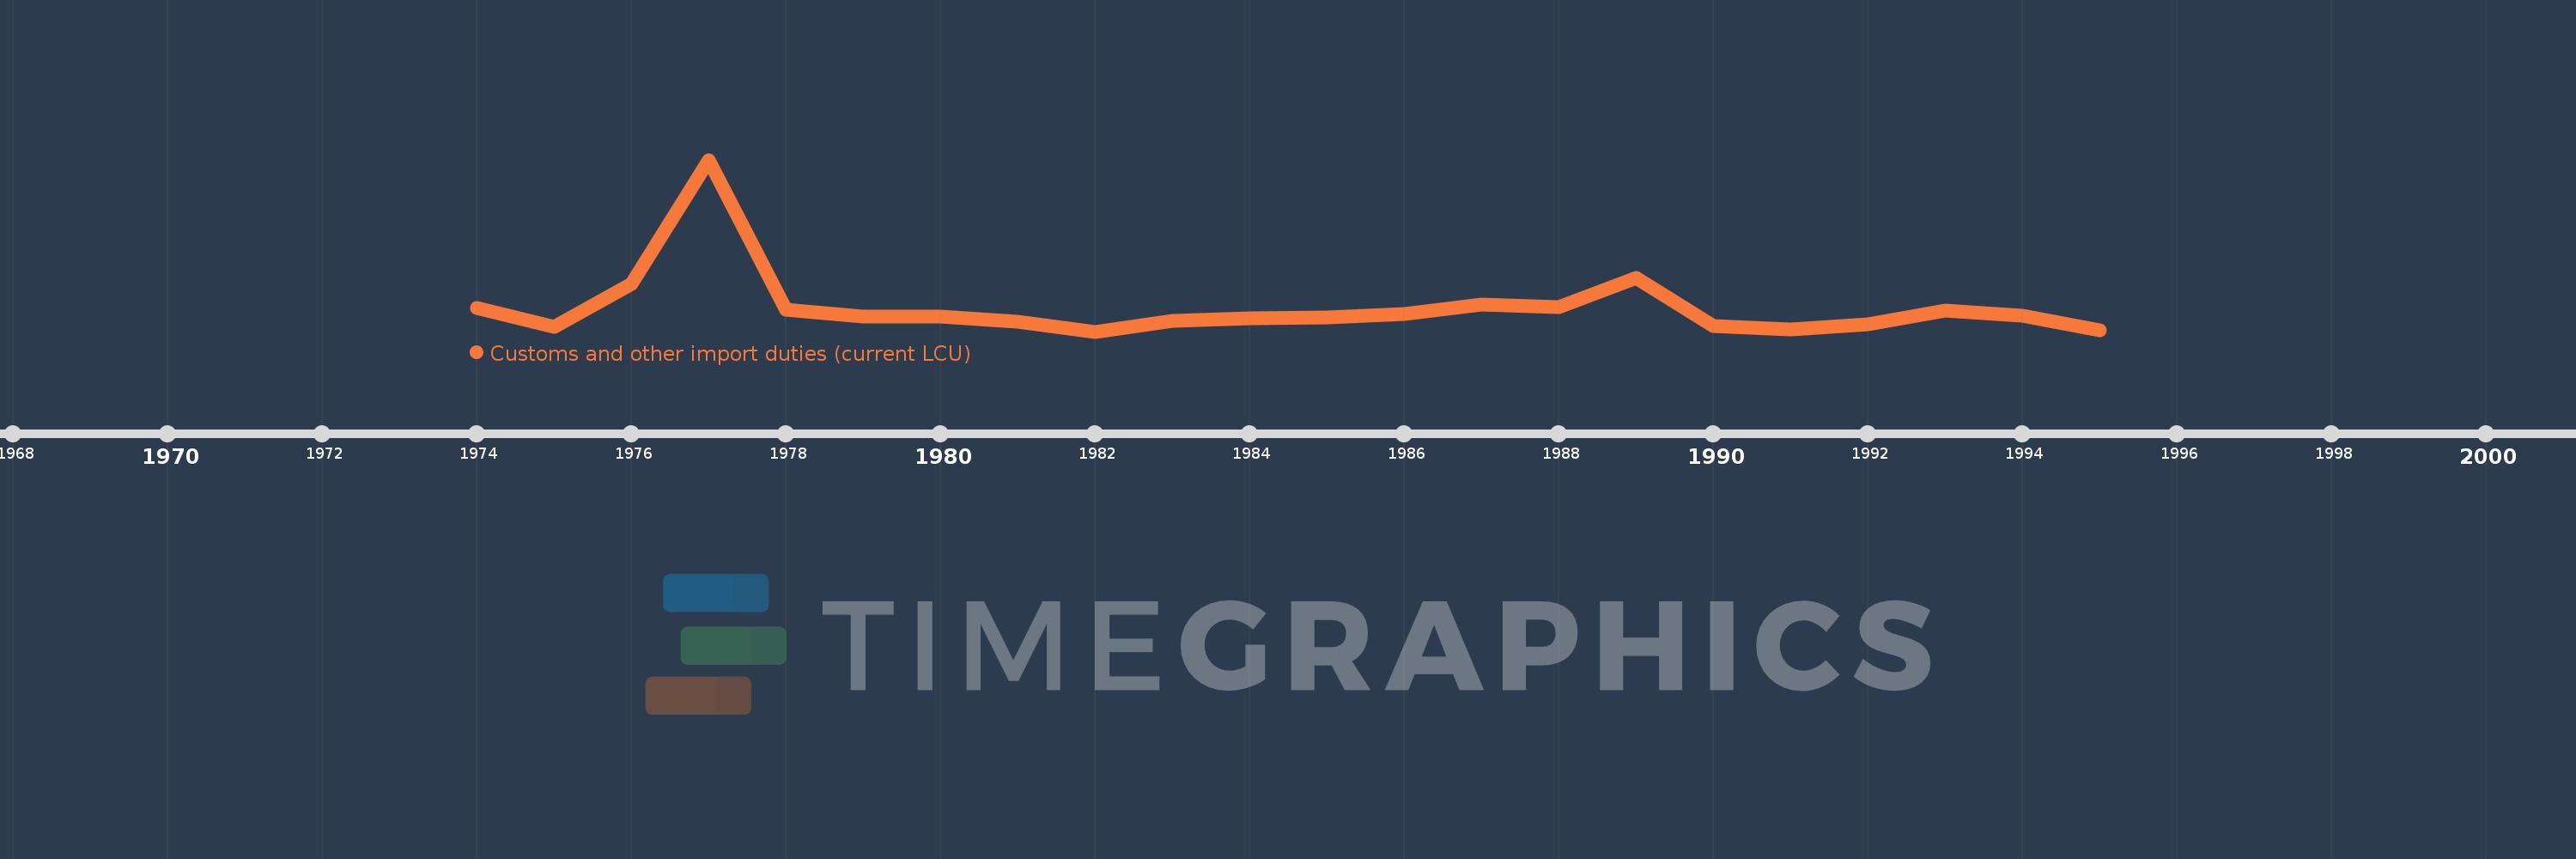
Customs and other import duties (current LCU)
1995,1994,1993,1992,1991,1990,1989,1988,1987,1986,1985,1984,1983,1982,1981,1980,1979,1978,1977,1976,1975,1974
This statistics in other country:
AfghanistanAlbaniaAlgeriaAngolaAntigua and BarbudaArgentinaArmeniaAustraliaAustriaAzerbaijanBahamas, TheBahrainBangladeshBarbadosBelarusBelizeBeninBhutanBoliviaBosnia and HerzegovinaBotswanaBrazilBulgariaBurkina FasoBurundiCabo VerdeCambodiaCentral African RepublicChileChinaColombiaCongo, Dem. Rep.Congo, Rep.Costa RicaCote d'IvoireCroatiaCyprusCzech RepublicDenmarkDominicaDominican RepublicEgypt, Arab Rep.El SalvadorEquatorial GuineaEstoniaEthiopiaFijiFinlandFranceGambia, TheGeorgiaGermanyGhanaGreeceGrenadaGuatemalaHondurasHong Kong SAR, ChinaHungaryIcelandIndiaIndonesiaIran, Islamic Rep.IraqIrelandIsraelItalyJamaicaJapanJordanKazakhstanKenyaKiribatiKorea, Rep.KuwaitKyrgyz RepublicLao PDRLatviaLebanonLiberiaLithuaniaLuxembourgMacedonia, FYRMadagascarMalawiMalaysiaMaldivesMaliMaltaMauritiusMexicoMicronesia, Fed. Sts.MoldovaMongoliaMoroccoMozambiqueMyanmarNamibiaNepalNetherlandsNew ZealandNicaraguaNorwayOmanPakistanPanamaPapua New GuineaParaguayPeruPhilippinesPolandPortugalQatarRomaniaRussian FederationRwandaSamoaSan MarinoSao Tome and PrincipeSenegalSerbiaSeychellesSierra LeoneSingaporeSlovak RepublicSloveniaSolomon IslandsSouth AfricaSpainSri LankaSt. Kitts and NevisSt. LuciaSurinameSwazilandSwedenSwitzerlandSyrian Arab RepublicTajikistanTanzaniaThailandTogoTrinidad and TobagoTunisiaTurkeyUgandaUkraineUnited Arab EmiratesUnited KingdomUnited StatesUruguayVanuatuVenezuela, RBVietnamWest Bank and GazaYemen, Rep.ZambiaZimbabwe Timeline:
This timeline shows a graph from 1974 to 1995 of Italy. No data until 1973. Number of actual observations by date: 22.
Source name:
World Development Indicators
Source organization:
International Monetary Fund, Government Finance Statistics Yearbook and data files.
Categories, topics:
Public Sector
Last updated:
apr 23, 2017
Indicators value changes by year
Minimum:
22.724 mln
jan 1, 1982
Maximum:
200.902 mln
jan 1, 1977
At the date of observation
Value
Absolute change
Change from previous value
jan 1, 1974
46.998 mln
+46.998 mln
0.0%
jan 1, 1975
27.372 mln
-19.625 mln
-41.76%
jan 1, 1976
72.304 mln
+44.932 mln
164.15%
jan 1, 1977
200.902 mln
+128.598 mln
177.86%
jan 1, 1978
45.448 mln
-155.454 mln
-77.38%
jan 1, 1979
38.734 mln
-6.714 mln
-14.77%
jan 1, 1980
38.734 mln
0.0
0.0%
jan 1, 1981
33.053 mln
-5.681 mln
-14.67%
jan 1, 1982
22.724 mln
-10.329 mln
-31.25%
jan 1, 1983
34.086 mln
+11.362 mln
50.0%
jan 1, 1984
36.152 mln
+2.066 mln
6.06%
jan 1, 1985
37.701 mln
+1.549 mln
4.29%
jan 1, 1986
41.317 mln
+3.615 mln
9.59%
jan 1, 1987
50.613 mln
+9.296 mln
22.5%
jan 1, 1988
48.03 mln
-2.582 mln
-5.1%
jan 1, 1989
78.501 mln
+30.471 mln
63.44%
jan 1, 1990
28.405 mln
-50.096 mln
-63.82%
jan 1, 1991
25.306 mln
-3.099 mln
-10.91%
jan 1, 1992
30.471 mln
+5.165 mln
20.41%
jan 1, 1993
44.932 mln
+14.461 mln
47.46%
jan 1, 1994
39.251 mln
-5.681 mln
-12.64%
jan 1, 1995
23.757 mln
-15.494 mln
-39.47%
Ranking of countries by current statistics by years


Comments: