29
/
en
AIzaSyAYiBZKx7MnpbEhh9jyipgxe19OcubqV5w
April 1, 2024
285724
Zambia
ZMB
true
2
1
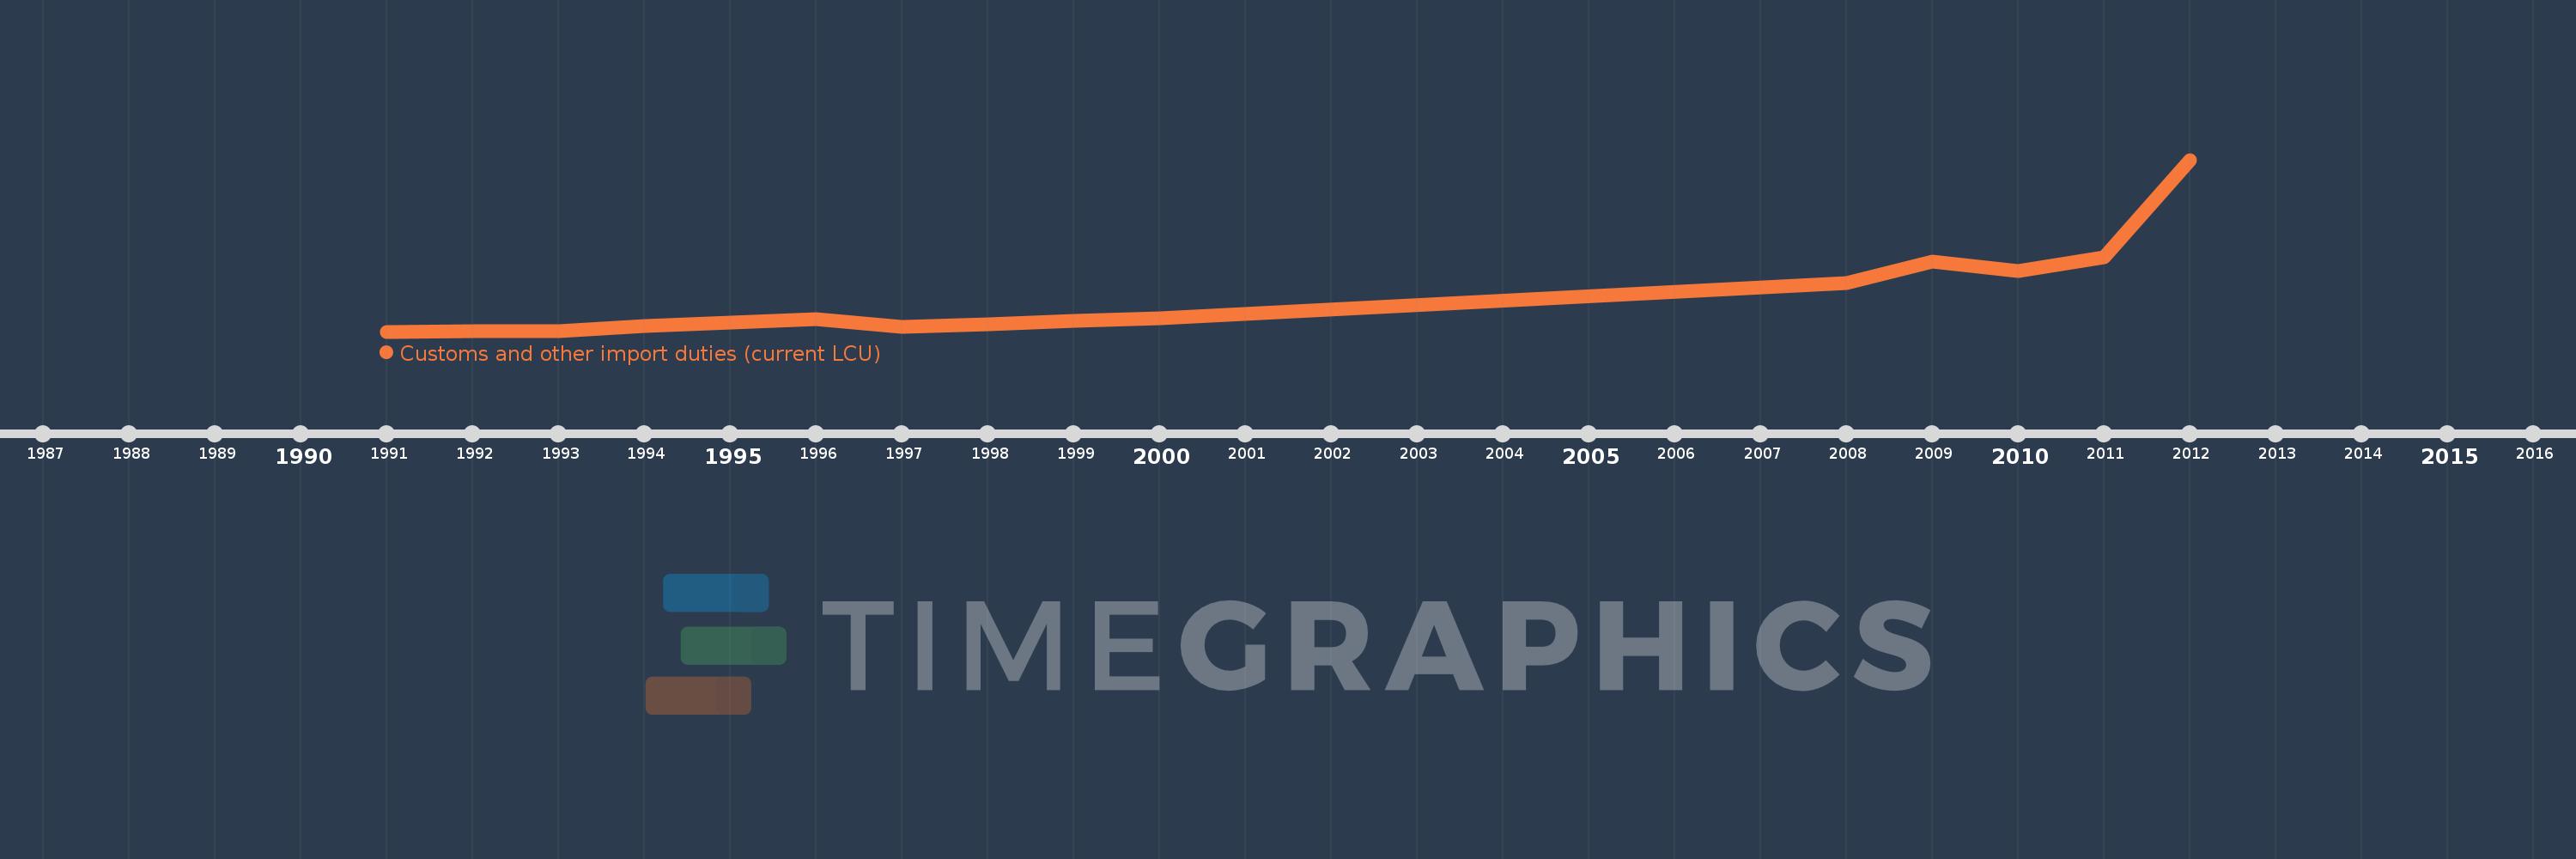
Customs and other import duties (current LCU)
2012,2011,2010,2009,2008,2000,1999,1998,1997,1996,1995,1994,1993,1992,1991
This statistics in other country:
AfghanistanAlbaniaAlgeriaAngolaAntigua and BarbudaArgentinaArmeniaAustraliaAustriaAzerbaijanBahamas, TheBahrainBangladeshBarbadosBelarusBelizeBeninBhutanBoliviaBosnia and HerzegovinaBotswanaBrazilBulgariaBurkina FasoBurundiCabo VerdeCambodiaCentral African RepublicChileChinaColombiaCongo, Dem. Rep.Congo, Rep.Costa RicaCote d'IvoireCroatiaCyprusCzech RepublicDenmarkDominicaDominican RepublicEgypt, Arab Rep.El SalvadorEquatorial GuineaEstoniaEthiopiaFijiFinlandFranceGambia, TheGeorgiaGermanyGhanaGreeceGrenadaGuatemalaHondurasHong Kong SAR, ChinaHungaryIcelandIndiaIndonesiaIran, Islamic Rep.IraqIrelandIsraelItalyJamaicaJapanJordanKazakhstanKenyaKiribatiKorea, Rep.KuwaitKyrgyz RepublicLao PDRLatviaLebanonLiberiaLithuaniaLuxembourgMacedonia, FYRMadagascarMalawiMalaysiaMaldivesMaliMaltaMauritiusMexicoMicronesia, Fed. Sts.MoldovaMongoliaMoroccoMozambiqueMyanmarNamibiaNepalNetherlandsNew ZealandNicaraguaNorwayOmanPakistanPanamaPapua New GuineaParaguayPeruPhilippinesPolandPortugalQatarRomaniaRussian FederationRwandaSamoaSan MarinoSao Tome and PrincipeSenegalSerbiaSeychellesSierra LeoneSingaporeSlovak RepublicSloveniaSolomon IslandsSouth AfricaSpainSri LankaSt. Kitts and NevisSt. LuciaSurinameSwazilandSwedenSwitzerlandSyrian Arab RepublicTajikistanTanzaniaThailandTogoTrinidad and TobagoTunisiaTurkeyUgandaUkraineUnited Arab EmiratesUnited KingdomUnited StatesUruguayVanuatuVenezuela, RBVietnamWest Bank and GazaYemen, Rep.ZambiaZimbabwe Timeline:
This timeline shows a graph from 1991 to 2012 of Zambia. No data until 1990. Number of actual observations by date: 15.
Source name:
World Development Indicators
Source organization:
International Monetary Fund, Government Finance Statistics Yearbook and data files.
Categories, topics:
Public Sector
Last updated:
apr 23, 2017
Indicators value changes by year
Minimum:
3.959 mln
jan 1, 1991
Maximum:
2.906 bln
jan 1, 2012
At the date of observation
Value
Absolute change
Change from previous value
jan 1, 1991
3.959 mln
+3.959 mln
0.0%
jan 1, 1992
12.191 mln
+8.232 mln
207.93%
jan 1, 1993
18.424 mln
+6.233 mln
51.13%
jan 1, 1994
91.811 mln
+73.387 mln
398.33%
jan 1, 1995
161.9 mln
+70.089 mln
76.34%
jan 1, 1996
216.9 mln
+55.0 mln
33.97%
jan 1, 1997
90.0 mln
-126.9 mln
-58.51%
jan 1, 1998
123.7 mln
+33.7 mln
37.44%
jan 1, 1999
183.9 mln
+60.2 mln
48.67%
jan 1, 2000
236.0 mln
+52.1 mln
28.33%
jan 1, 2008
821.338 mln
+585.338 mln
248.02%
jan 1, 2009
1.183 bln
+361.164 mln
43.97%
jan 1, 2010
1.023 bln
-159.042 mln
-13.45%
jan 1, 2011
1.261 bln
+237.709 mln
23.23%
jan 1, 2012
2.906 bln
+1.645 bln
130.41%
Ranking of countries by current statistics by years


Comments: