29
/
en
AIzaSyAYiBZKx7MnpbEhh9jyipgxe19OcubqV5w
April 1, 2024
65825
Algeria
DZA
true
2
1
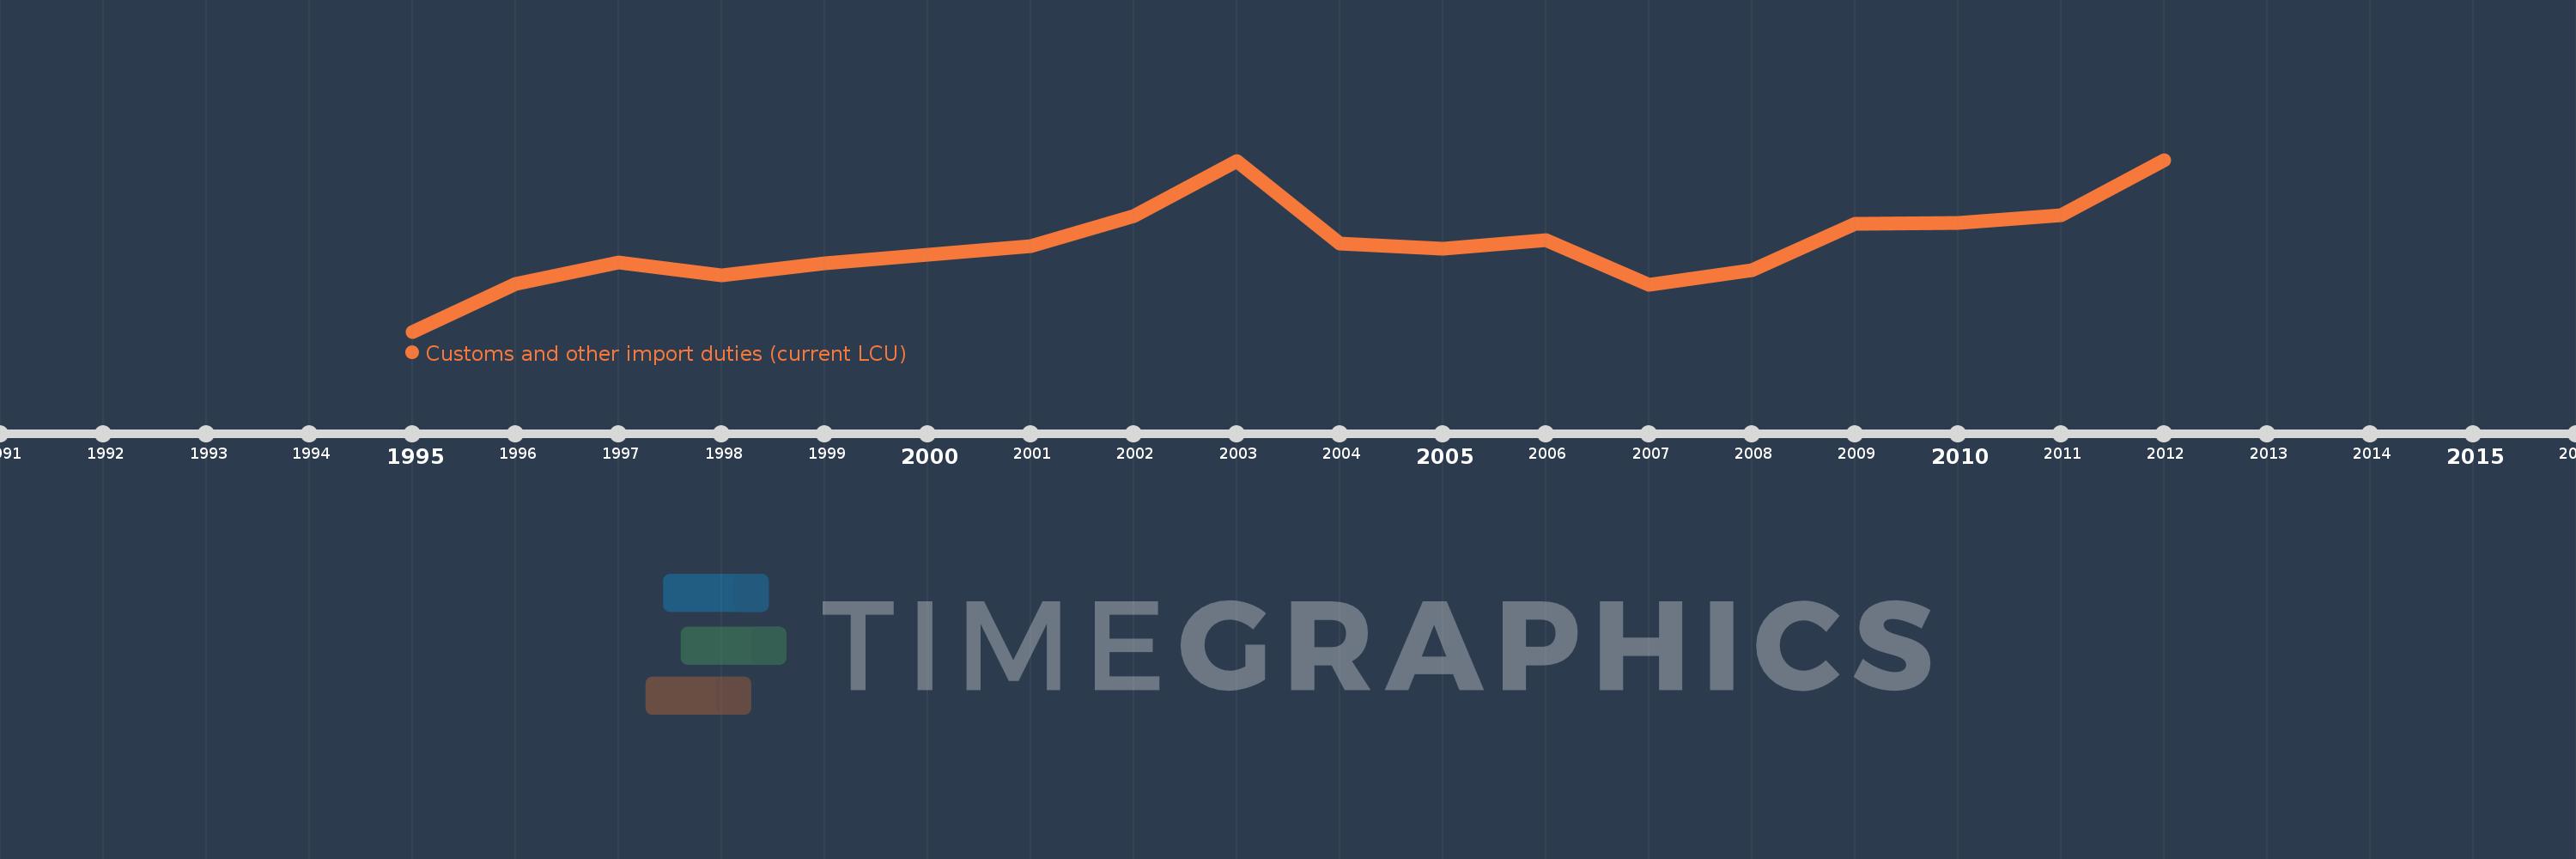
Customs and other import duties (current LCU)
2012,2011,2010,2009,2008,2007,2006,2005,2004,2003,2002,2001,2000,1999,1998,1997,1996,1995
This statistics in other country:
AfghanistanAlbaniaAlgeriaAngolaAntigua and BarbudaArgentinaArmeniaAustraliaAustriaAzerbaijanBahamas, TheBahrainBangladeshBarbadosBelarusBelizeBeninBhutanBoliviaBosnia and HerzegovinaBotswanaBrazilBulgariaBurkina FasoBurundiCabo VerdeCambodiaCentral African RepublicChileChinaColombiaCongo, Dem. Rep.Congo, Rep.Costa RicaCote d'IvoireCroatiaCyprusCzech RepublicDenmarkDominicaDominican RepublicEgypt, Arab Rep.El SalvadorEquatorial GuineaEstoniaEthiopiaFijiFinlandFranceGambia, TheGeorgiaGermanyGhanaGreeceGrenadaGuatemalaHondurasHong Kong SAR, ChinaHungaryIcelandIndiaIndonesiaIran, Islamic Rep.IraqIrelandIsraelItalyJamaicaJapanJordanKazakhstanKenyaKiribatiKorea, Rep.KuwaitKyrgyz RepublicLao PDRLatviaLebanonLiberiaLithuaniaLuxembourgMacedonia, FYRMadagascarMalawiMalaysiaMaldivesMaliMaltaMauritiusMexicoMicronesia, Fed. Sts.MoldovaMongoliaMoroccoMozambiqueMyanmarNamibiaNepalNetherlandsNew ZealandNicaraguaNorwayOmanPakistanPanamaPapua New GuineaParaguayPeruPhilippinesPolandPortugalQatarRomaniaRussian FederationRwandaSamoaSan MarinoSao Tome and PrincipeSenegalSerbiaSeychellesSierra LeoneSingaporeSlovak RepublicSloveniaSolomon IslandsSouth AfricaSpainSri LankaSt. Kitts and NevisSt. LuciaSurinameSwazilandSwedenSwitzerlandSyrian Arab RepublicTajikistanTanzaniaThailandTogoTrinidad and TobagoTunisiaTurkeyUgandaUkraineUnited Arab EmiratesUnited KingdomUnited StatesUruguayVanuatuVenezuela, RBVietnamWest Bank and GazaYemen, Rep.ZambiaZimbabwe Timeline:
This timeline shows a graph from 1995 to 2012 of Algeria. No data until 1994. Number of actual observations by date: 18.
Source name:
World Development Indicators
Source organization:
International Monetary Fund, Government Finance Statistics Yearbook and data files.
Categories, topics:
Public Sector
Last updated:
apr 23, 2017
Indicators value changes by year
Minimum:
73.029 bln
jan 1, 1995
Maximum:
208.858 bln
jan 1, 2012
At the date of observation
Value
Absolute change
Change from previous value
jan 1, 1995
73.029 bln
+73.029 bln
0.0%
jan 1, 1996
110.98 bln
+37.951 bln
51.97%
jan 1, 1997
127.836 bln
+16.856 bln
15.19%
jan 1, 1998
117.193 bln
-10.643 bln
-8.33%
jan 1, 1999
126.996 bln
+9.803 bln
8.36%
jan 1, 2000
133.537 bln
+6.541 bln
5.15%
jan 1, 2001
140.815 bln
+7.278 bln
5.45%
jan 1, 2002
164.5 bln
+23.685 bln
16.82%
jan 1, 2003
207.5 bln
+43.0 bln
26.14%
jan 1, 2004
142.89 bln
-64.61 bln
-31.14%
jan 1, 2005
138.564 bln
-4.326 bln
-3.03%
jan 1, 2006
145.204 bln
+6.64 bln
4.79%
jan 1, 2007
109.86 bln
-35.344 bln
-24.34%
jan 1, 2008
121.51 bln
+11.65 bln
10.6%
jan 1, 2009
158.57 bln
+37.06 bln
30.5%
jan 1, 2010
158.839 bln
+268.501 mln
0.17%
jan 1, 2011
165.1 bln
+6.261 bln
3.94%
jan 1, 2012
208.858 bln
+43.758 bln
26.5%
Ranking of countries by current statistics by years


Comments: