29
/
en
AIzaSyAYiBZKx7MnpbEhh9jyipgxe19OcubqV5w
April 1, 2024
118762
Denmark
DNK
true
2
1
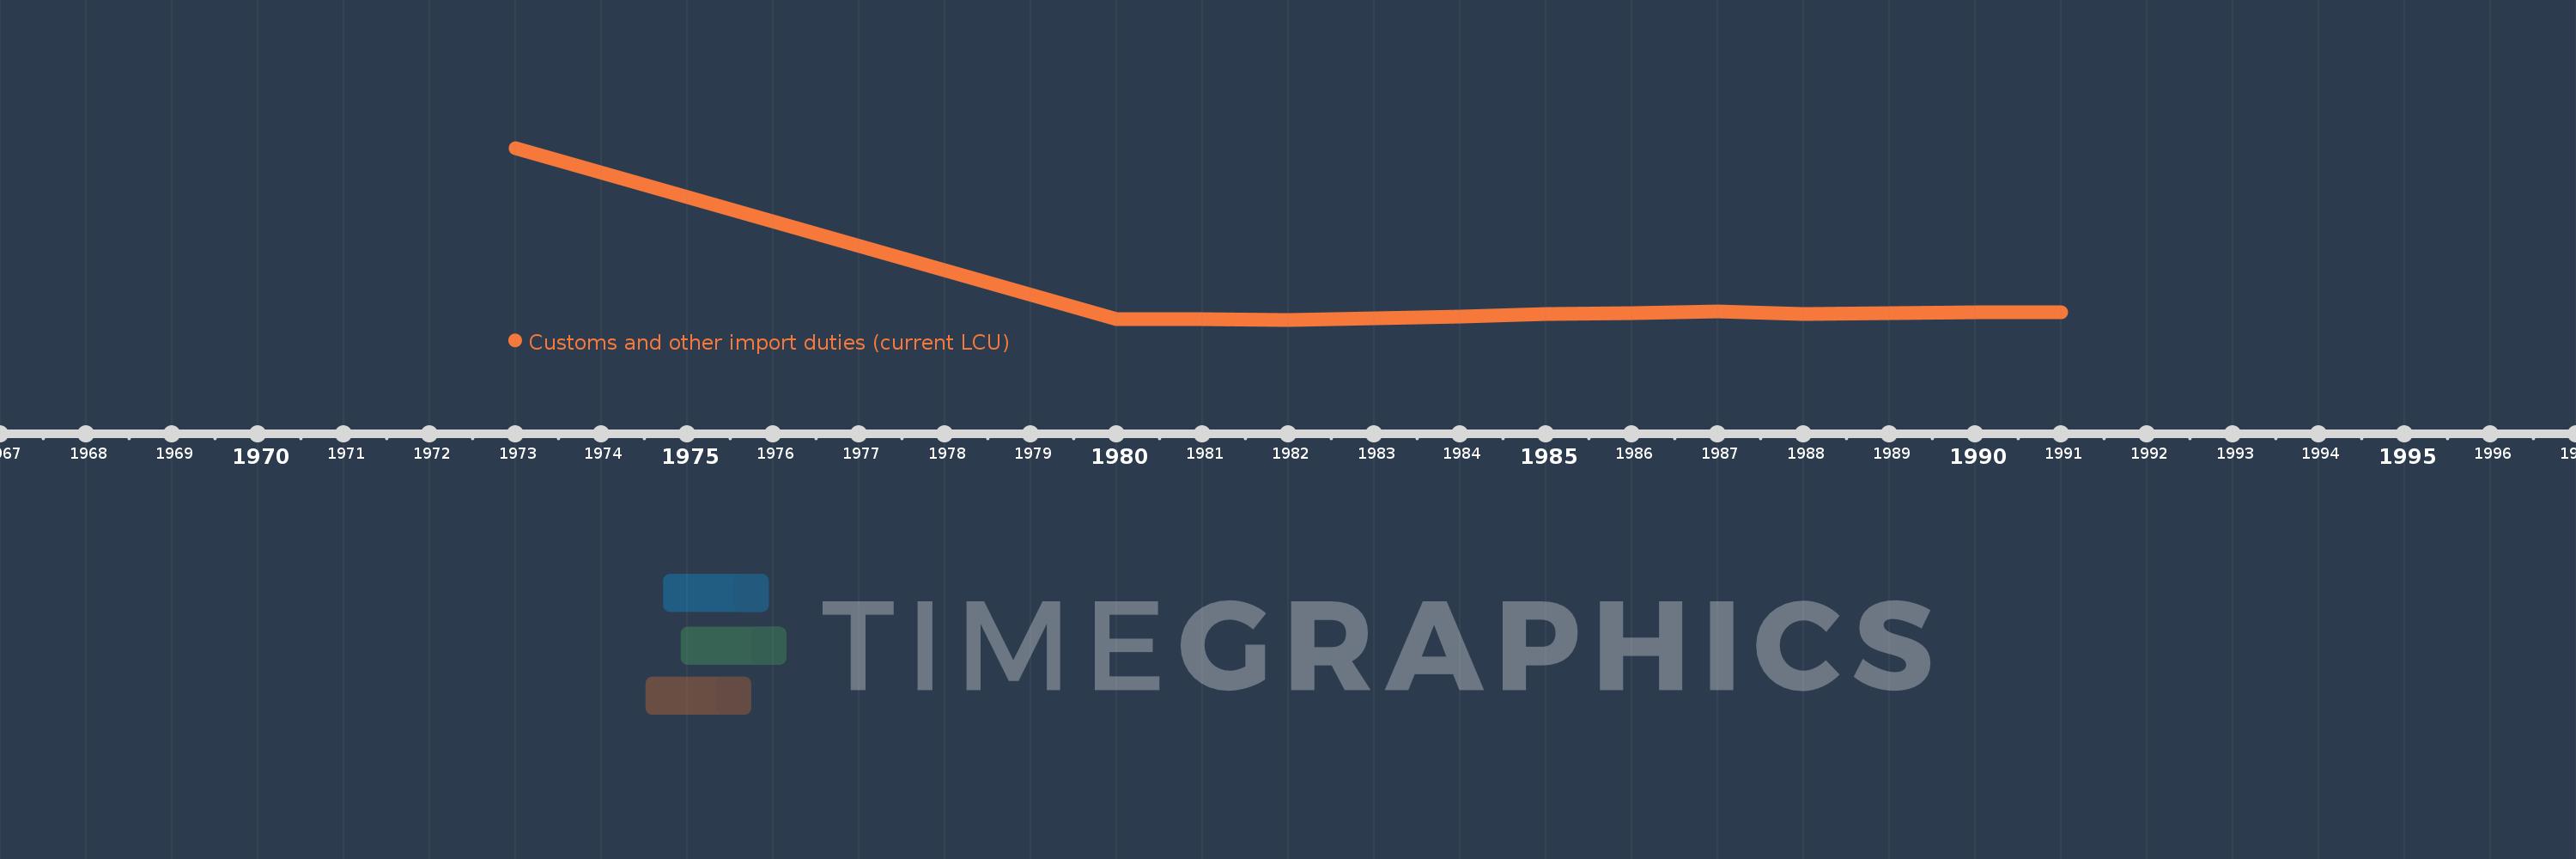
Customs and other import duties (current LCU)
1991,1990,1989,1988,1987,1986,1985,1984,1983,1982,1981,1980,1973
This statistics in other country:
AfghanistanAlbaniaAlgeriaAngolaAntigua and BarbudaArgentinaArmeniaAustraliaAustriaAzerbaijanBahamas, TheBahrainBangladeshBarbadosBelarusBelizeBeninBhutanBoliviaBosnia and HerzegovinaBotswanaBrazilBulgariaBurkina FasoBurundiCabo VerdeCambodiaCentral African RepublicChileChinaColombiaCongo, Dem. Rep.Congo, Rep.Costa RicaCote d'IvoireCroatiaCyprusCzech RepublicDenmarkDominicaDominican RepublicEgypt, Arab Rep.El SalvadorEquatorial GuineaEstoniaEthiopiaFijiFinlandFranceGambia, TheGeorgiaGermanyGhanaGreeceGrenadaGuatemalaHondurasHong Kong SAR, ChinaHungaryIcelandIndiaIndonesiaIran, Islamic Rep.IraqIrelandIsraelItalyJamaicaJapanJordanKazakhstanKenyaKiribatiKorea, Rep.KuwaitKyrgyz RepublicLao PDRLatviaLebanonLiberiaLithuaniaLuxembourgMacedonia, FYRMadagascarMalawiMalaysiaMaldivesMaliMaltaMauritiusMexicoMicronesia, Fed. Sts.MoldovaMongoliaMoroccoMozambiqueMyanmarNamibiaNepalNetherlandsNew ZealandNicaraguaNorwayOmanPakistanPanamaPapua New GuineaParaguayPeruPhilippinesPolandPortugalQatarRomaniaRussian FederationRwandaSamoaSan MarinoSao Tome and PrincipeSenegalSerbiaSeychellesSierra LeoneSingaporeSlovak RepublicSloveniaSolomon IslandsSouth AfricaSpainSri LankaSt. Kitts and NevisSt. LuciaSurinameSwazilandSwedenSwitzerlandSyrian Arab RepublicTajikistanTanzaniaThailandTogoTrinidad and TobagoTunisiaTurkeyUgandaUkraineUnited Arab EmiratesUnited KingdomUnited StatesUruguayVanuatuVenezuela, RBVietnamWest Bank and GazaYemen, Rep.ZambiaZimbabwe Timeline:
This timeline shows a graph from 1973 to 1991 of Denmark. No data until 1972. Number of actual observations by date: 13.
Source name:
World Development Indicators
Source organization:
International Monetary Fund, Government Finance Statistics Yearbook and data files.
Categories, topics:
Public Sector
Last updated:
apr 23, 2017
Indicators value changes by year
Minimum:
109.0 mln
jan 1, 1982
Maximum:
1.639 bln
jan 1, 1973
At the date of observation
Value
Absolute change
Change from previous value
jan 1, 1973
1.639 bln
+1.639 bln
0.0%
jan 1, 1980
115.0 mln
-1.524 bln
-92.98%
jan 1, 1981
115.0 mln
0.0
0.0%
jan 1, 1982
109.0 mln
-6.0 mln
-5.22%
jan 1, 1983
122.0 mln
+13.0 mln
11.93%
jan 1, 1984
137.0 mln
+15.0 mln
12.3%
jan 1, 1985
164.0 mln
+27.0 mln
19.71%
jan 1, 1986
166.0 mln
+2.0 mln
1.22%
jan 1, 1987
180.0 mln
+14.0 mln
8.43%
jan 1, 1988
159.0 mln
-21.0 mln
-11.67%
jan 1, 1989
170.0 mln
+11.0 mln
6.92%
jan 1, 1990
176.0 mln
+6.0 mln
3.53%
jan 1, 1991
178.0 mln
+2.0 mln
1.14%
Ranking of countries by current statistics by years


Comments: