29
/
en
AIzaSyAYiBZKx7MnpbEhh9jyipgxe19OcubqV5w
April 1, 2024
107056
Colombia
COL
true
2
1
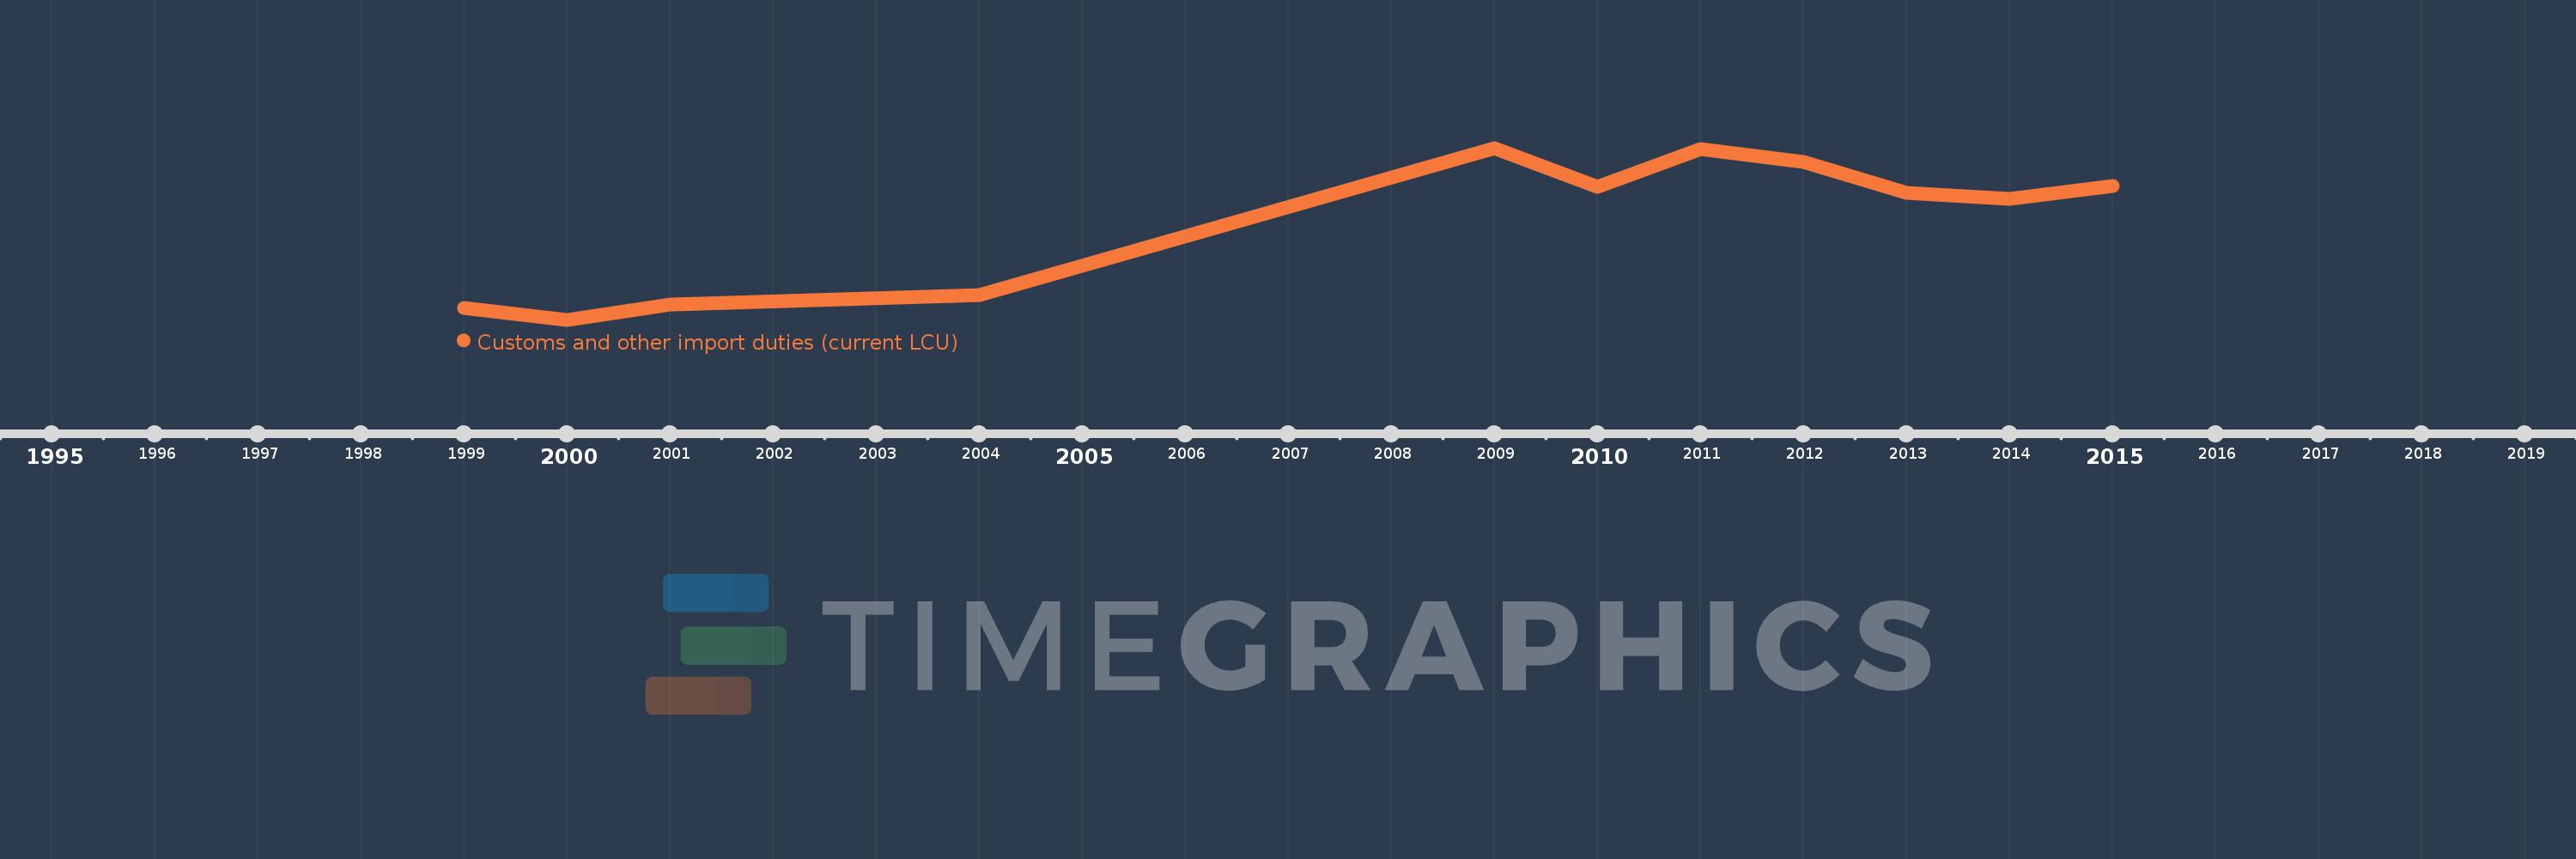
Customs and other import duties (current LCU)
2015,2014,2013,2012,2011,2010,2009,2004,2001,2000,1999
This statistics in other country:
AfghanistanAlbaniaAlgeriaAngolaAntigua and BarbudaArgentinaArmeniaAustraliaAustriaAzerbaijanBahamas, TheBahrainBangladeshBarbadosBelarusBelizeBeninBhutanBoliviaBosnia and HerzegovinaBotswanaBrazilBulgariaBurkina FasoBurundiCabo VerdeCambodiaCentral African RepublicChileChinaColombiaCongo, Dem. Rep.Congo, Rep.Costa RicaCote d'IvoireCroatiaCyprusCzech RepublicDenmarkDominicaDominican RepublicEgypt, Arab Rep.El SalvadorEquatorial GuineaEstoniaEthiopiaFijiFinlandFranceGambia, TheGeorgiaGermanyGhanaGreeceGrenadaGuatemalaHondurasHong Kong SAR, ChinaHungaryIcelandIndiaIndonesiaIran, Islamic Rep.IraqIrelandIsraelItalyJamaicaJapanJordanKazakhstanKenyaKiribatiKorea, Rep.KuwaitKyrgyz RepublicLao PDRLatviaLebanonLiberiaLithuaniaLuxembourgMacedonia, FYRMadagascarMalawiMalaysiaMaldivesMaliMaltaMauritiusMexicoMicronesia, Fed. Sts.MoldovaMongoliaMoroccoMozambiqueMyanmarNamibiaNepalNetherlandsNew ZealandNicaraguaNorwayOmanPakistanPanamaPapua New GuineaParaguayPeruPhilippinesPolandPortugalQatarRomaniaRussian FederationRwandaSamoaSan MarinoSao Tome and PrincipeSenegalSerbiaSeychellesSierra LeoneSingaporeSlovak RepublicSloveniaSolomon IslandsSouth AfricaSpainSri LankaSt. Kitts and NevisSt. LuciaSurinameSwazilandSwedenSwitzerlandSyrian Arab RepublicTajikistanTanzaniaThailandTogoTrinidad and TobagoTunisiaTurkeyUgandaUkraineUnited Arab EmiratesUnited KingdomUnited StatesUruguayVanuatuVenezuela, RBVietnamWest Bank and GazaYemen, Rep.ZambiaZimbabwe Timeline:
This timeline shows a graph from 1999 to 2015 of Colombia. No data until 1998. Number of actual observations by date: 11.
Source name:
World Development Indicators
Source organization:
International Monetary Fund, Government Finance Statistics Yearbook and data files.
Categories, topics:
Public Sector
Last updated:
apr 23, 2017
Indicators value changes by year
Minimum:
1.373 trl
jan 1, 2000
Maximum:
5.516 trl
jan 1, 2009
At the date of observation
Value
Absolute change
Change from previous value
jan 1, 1999
1.647 trl
+1.647 trl
0.0%
jan 1, 2000
1.373 trl
-274.02 bln
-16.64%
jan 1, 2001
1.744 trl
+371.476 bln
27.06%
jan 1, 2004
1.967 trl
+223.357 bln
12.81%
jan 1, 2009
5.516 trl
+3.548 trl
180.36%
jan 1, 2010
4.58 trl
-935.438 bln
-16.96%
jan 1, 2011
5.483 trl
+902.176 bln
19.7%
jan 1, 2012
5.169 trl
-313.29 bln
-5.71%
jan 1, 2013
4.429 trl
-740.722 bln
-14.33%
jan 1, 2014
4.286 trl
-143.048 bln
-3.23%
jan 1, 2015
4.599 trl
+313.51 bln
7.32%
Ranking of countries by current statistics by years


Comments: