29
/
en
AIzaSyAYiBZKx7MnpbEhh9jyipgxe19OcubqV5w
April 1, 2024
205108
Namibia
NAM
true
2
1
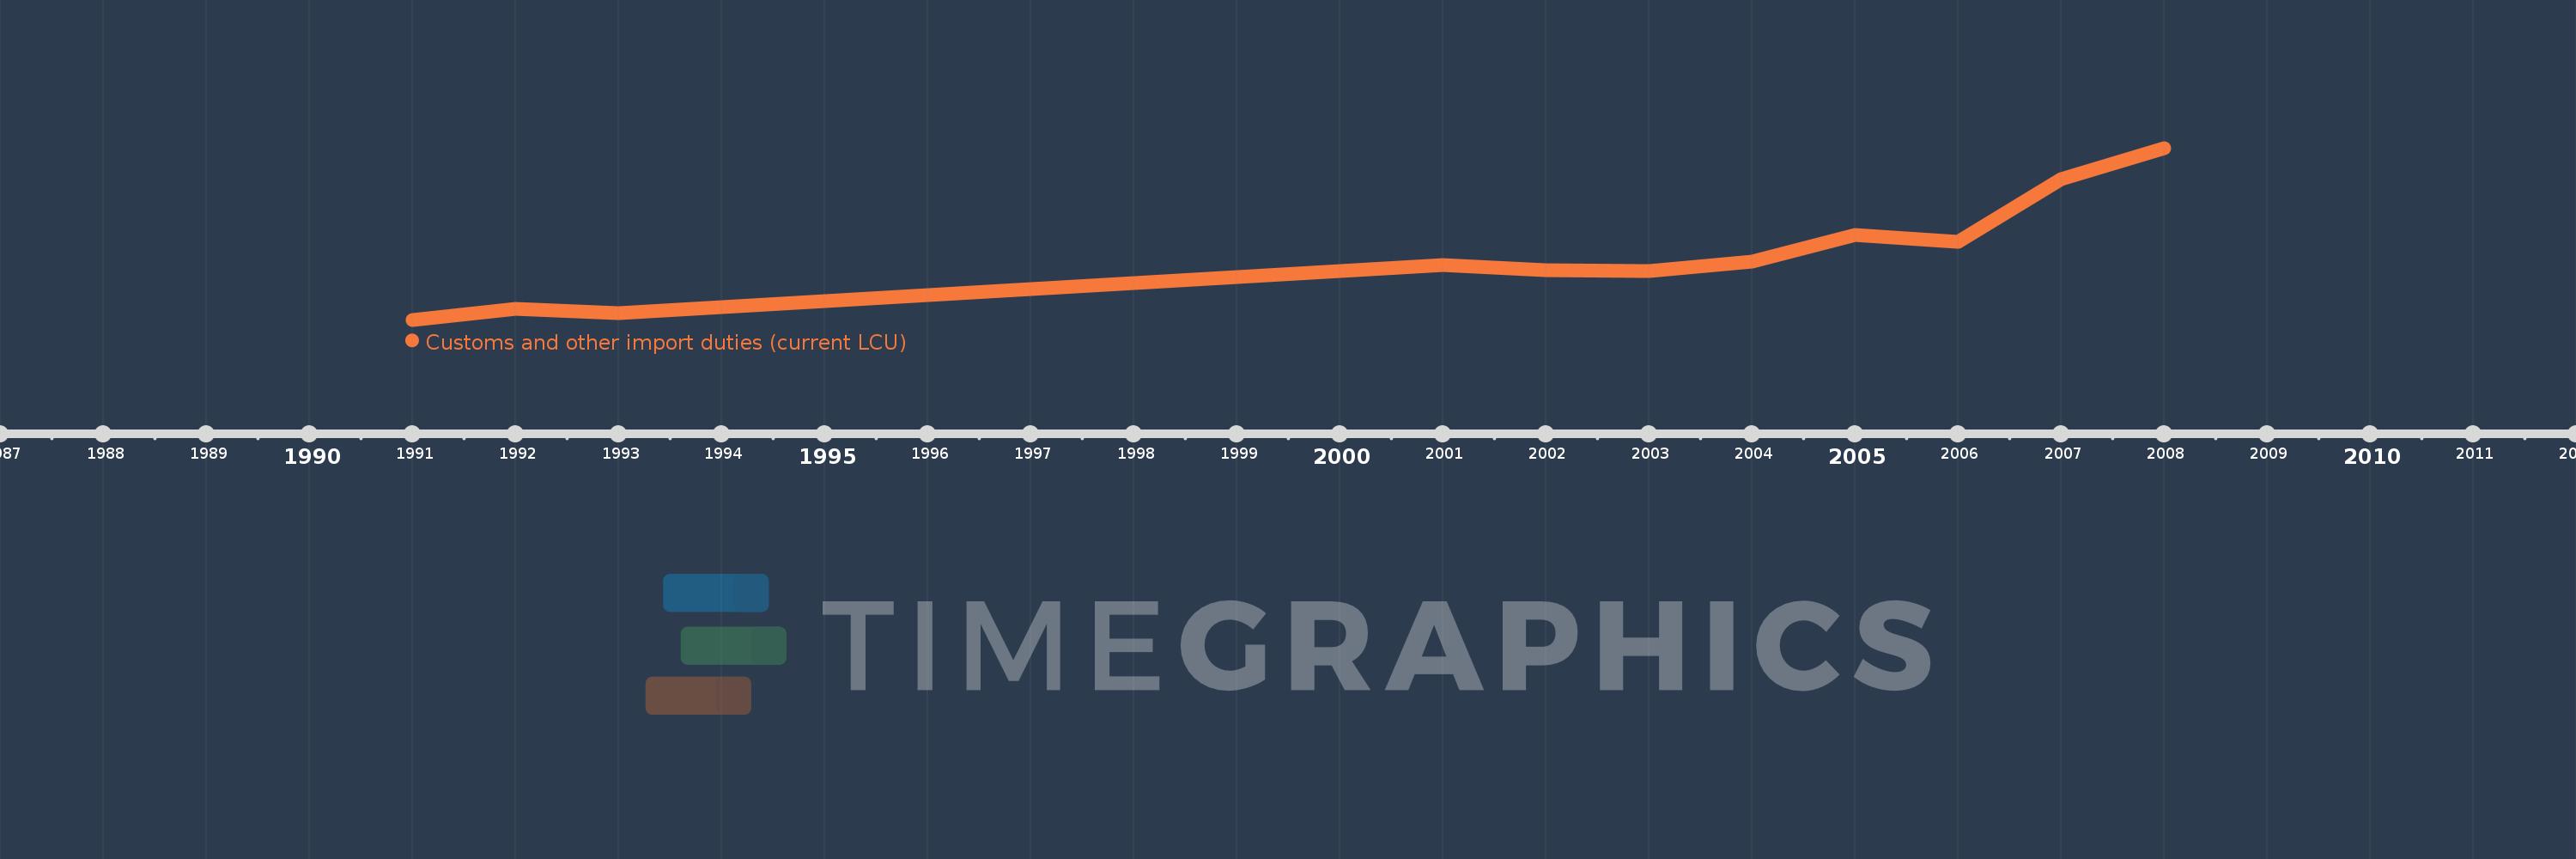
Customs and other import duties (current LCU)
2008,2007,2006,2005,2004,2003,2002,2001,1993,1992,1991
This statistics in other country:
AfghanistanAlbaniaAlgeriaAngolaAntigua and BarbudaArgentinaArmeniaAustraliaAustriaAzerbaijanBahamas, TheBahrainBangladeshBarbadosBelarusBelizeBeninBhutanBoliviaBosnia and HerzegovinaBotswanaBrazilBulgariaBurkina FasoBurundiCabo VerdeCambodiaCentral African RepublicChileChinaColombiaCongo, Dem. Rep.Congo, Rep.Costa RicaCote d'IvoireCroatiaCyprusCzech RepublicDenmarkDominicaDominican RepublicEgypt, Arab Rep.El SalvadorEquatorial GuineaEstoniaEthiopiaFijiFinlandFranceGambia, TheGeorgiaGermanyGhanaGreeceGrenadaGuatemalaHondurasHong Kong SAR, ChinaHungaryIcelandIndiaIndonesiaIran, Islamic Rep.IraqIrelandIsraelItalyJamaicaJapanJordanKazakhstanKenyaKiribatiKorea, Rep.KuwaitKyrgyz RepublicLao PDRLatviaLebanonLiberiaLithuaniaLuxembourgMacedonia, FYRMadagascarMalawiMalaysiaMaldivesMaliMaltaMauritiusMexicoMicronesia, Fed. Sts.MoldovaMongoliaMoroccoMozambiqueMyanmarNamibiaNepalNetherlandsNew ZealandNicaraguaNorwayOmanPakistanPanamaPapua New GuineaParaguayPeruPhilippinesPolandPortugalQatarRomaniaRussian FederationRwandaSamoaSan MarinoSao Tome and PrincipeSenegalSerbiaSeychellesSierra LeoneSingaporeSlovak RepublicSloveniaSolomon IslandsSouth AfricaSpainSri LankaSt. Kitts and NevisSt. LuciaSurinameSwazilandSwedenSwitzerlandSyrian Arab RepublicTajikistanTanzaniaThailandTogoTrinidad and TobagoTunisiaTurkeyUgandaUkraineUnited Arab EmiratesUnited KingdomUnited StatesUruguayVanuatuVenezuela, RBVietnamWest Bank and GazaYemen, Rep.ZambiaZimbabwe Timeline:
This timeline shows a graph from 1991 to 2008 of Namibia. No data until 1990. Number of actual observations by date: 11.
Source name:
World Development Indicators
Source organization:
International Monetary Fund, Government Finance Statistics Yearbook and data files.
Categories, topics:
Public Sector
Last updated:
apr 23, 2017
Indicators value changes by year
Minimum:
447.0 mln
jan 1, 1991
Maximum:
8.085 bln
jan 1, 2008
At the date of observation
Value
Absolute change
Change from previous value
jan 1, 1991
447.0 mln
+447.0 mln
0.0%
jan 1, 1992
945.7 mln
+498.7 mln
111.57%
jan 1, 1993
735.5 mln
-210.2 mln
-22.23%
jan 1, 2001
2.878 bln
+2.142 bln
291.26%
jan 1, 2002
2.643 bln
-235.06 mln
-8.17%
jan 1, 2003
2.598 bln
-44.217 mln
-1.67%
jan 1, 2004
3.036 bln
+437.956 mln
16.85%
jan 1, 2005
4.207 bln
+1.171 bln
38.56%
jan 1, 2006
3.893 bln
-313.695 mln
-7.46%
jan 1, 2007
6.698 bln
+2.805 bln
72.04%
jan 1, 2008
8.085 bln
+1.387 bln
20.71%
Ranking of countries by current statistics by years


Comments: