29
/
en
AIzaSyAYiBZKx7MnpbEhh9jyipgxe19OcubqV5w
April 1, 2024
84001
Benin
BEN
true
2
1
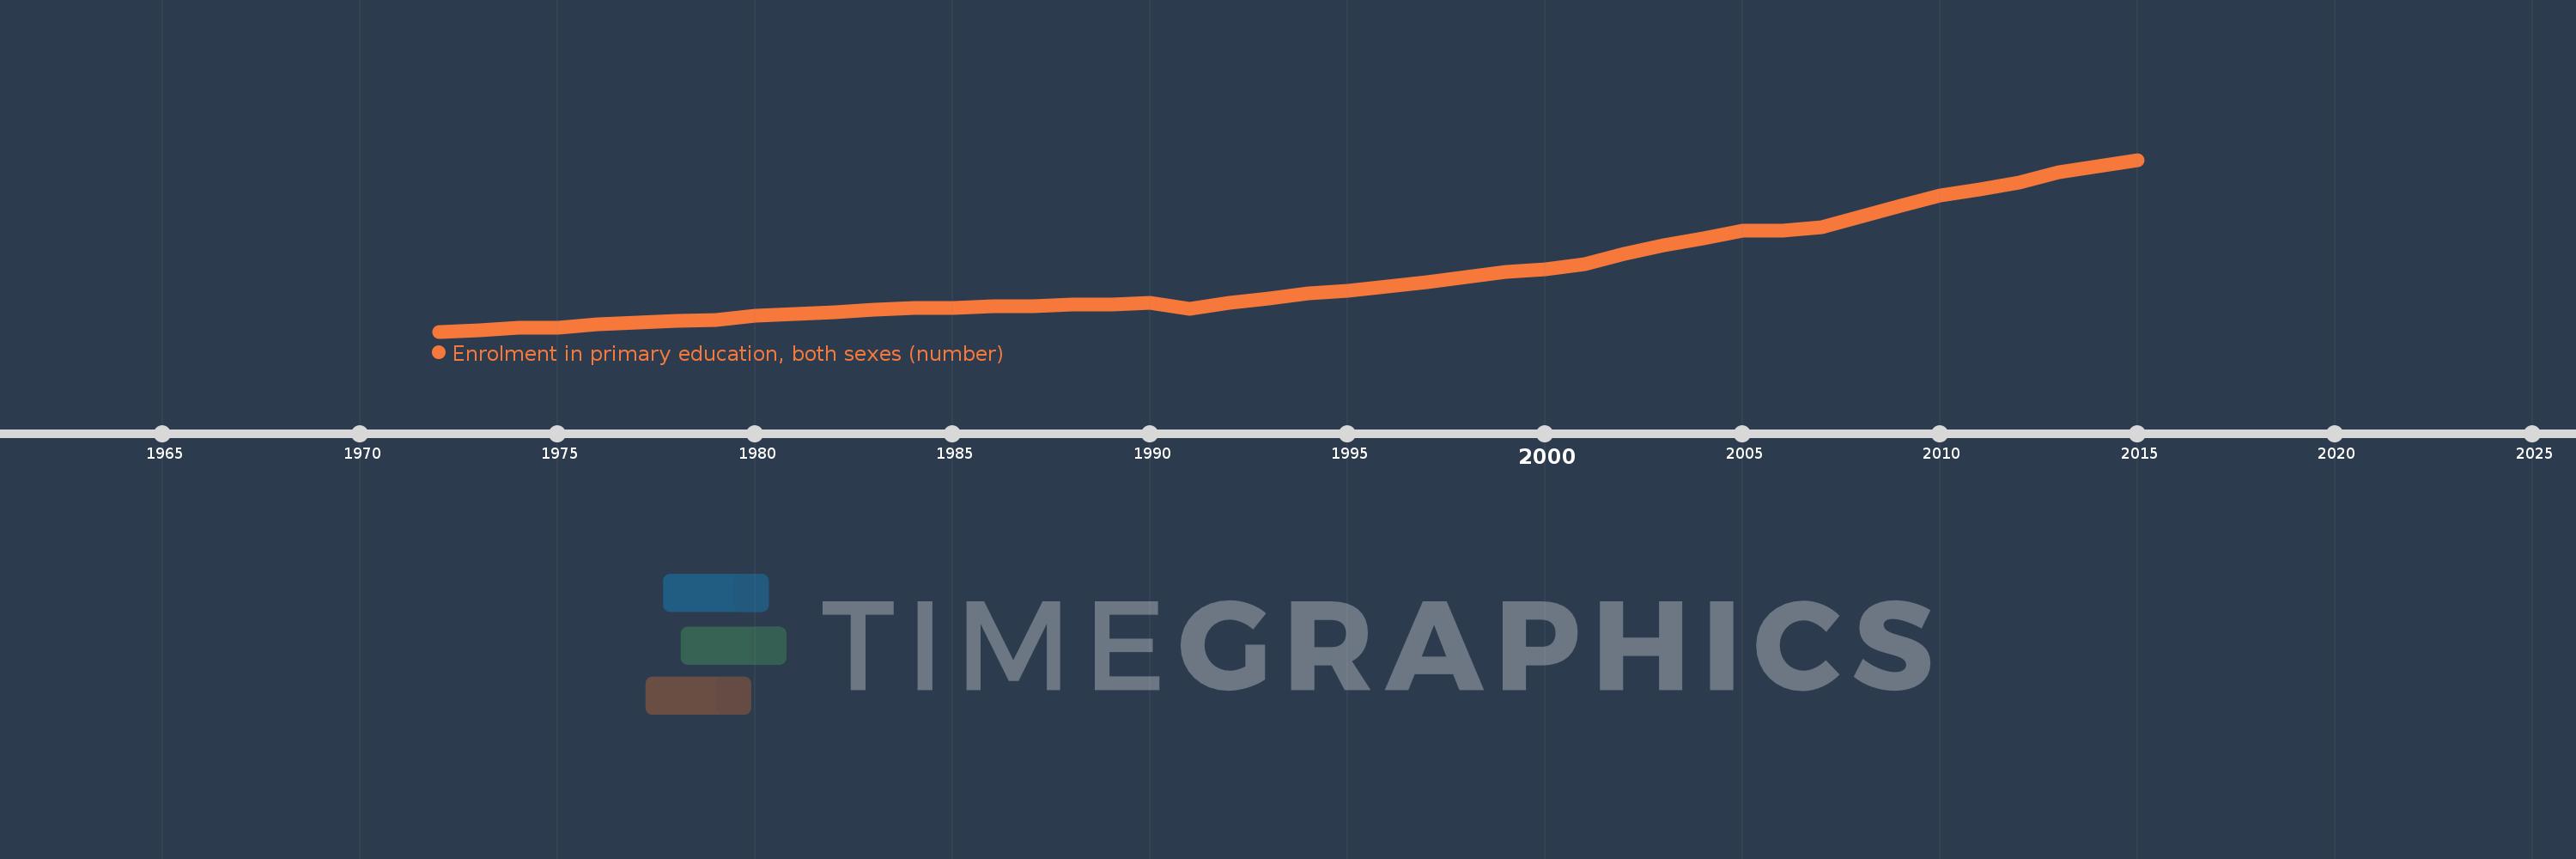
Enrolment in primary education, both sexes (number)
2015,2014,2013,2012,2011,2010,2009,2007,2006,2005,2004,2003,2002,2001,2000,1999,1998,1997,1996,1995,1994,1993,1992,1991,1990,1989,1988,1987,1986,1985,1984,1983,1982,1981,1980,1979,1978,1977,1976,1975,1974,1973,1972
This statistics in other country:
AfghanistanAlbaniaAlgeriaAmerican SamoaAndorraAngolaAntigua and BarbudaArab WorldArgentinaArmeniaArubaAustraliaAustriaAzerbaijanBahamas, TheBahrainBangladeshBarbadosBelarusBelgiumBelizeBeninBermudaBhutanBoliviaBosnia and HerzegovinaBotswanaBrazilBritish Virgin IslandsBrunei DarussalamBulgariaBurkina FasoBurundiCabo VerdeCambodiaCameroonCanadaCaribbean small statesCayman IslandsCentral African RepublicCentral Europe and the BalticsChadChileChinaColombiaComorosCongo, Dem. Rep.Congo, Rep.Costa RicaCote d'IvoireCroatiaCubaCuracaoCyprusCzech RepublicDenmarkDjiboutiDominicaDominican RepublicEarly-demographic dividendEast Asia & PacificEast Asia & Pacific (excluding high income)East Asia & Pacific (IDA & IBRD countries)EcuadorEgypt, Arab Rep.El SalvadorEquatorial GuineaEritreaEstoniaEthiopiaEuro areaEurope & Central AsiaEurope & Central Asia (excluding high income)Europe & Central Asia (IDA & IBRD countries)European UnionFaroe IslandsFijiFinlandFragile and conflict affected situationsFranceFrench PolynesiaGabonGambia, TheGeorgiaGermanyGhanaGibraltarGreeceGrenadaGuamGuatemalaGuineaGuinea-BissauGuyanaHaitiHeavily indebted poor countries (HIPC)High incomeHondurasHong Kong SAR, ChinaHungaryIBRD onlyIcelandIDA & IBRD totalIDA blendIDA onlyIDA totalIndiaIndonesiaIran, Islamic Rep.IraqIrelandIsraelItalyJamaicaJapanJordanKazakhstanKenyaKiribatiKorea, Dem. People’s Rep.Korea, Rep.KuwaitKyrgyz RepublicLao PDRLate-demographic dividendLatin America & Caribbean Latin America & Caribbean (excluding high income)Latin America & the Caribbean (IDA & IBRD countries)LatviaLeast developed countries: UN classificationLebanonLesothoLiberiaLibyaLiechtensteinLithuaniaLow & middle incomeLow incomeLower middle incomeLuxembourgMacao SAR, ChinaMacedonia, FYRMadagascarMalawiMalaysiaMaldivesMaliMaltaMarshall IslandsMauritaniaMauritiusMexicoMicronesia, Fed. Sts.Middle East & North AfricaMiddle East & North Africa (excluding high income)Middle East & North Africa (IDA & IBRD countries)Middle incomeMoldovaMonacoMongoliaMontenegroMoroccoMozambiqueMyanmarNamibiaNauruNepalNetherlandsNew CaledoniaNew ZealandNicaraguaNigerNigeriaNorth AmericaNorwayOECD membersOmanOther small statesPacific island small statesPakistanPalauPanamaPapua New GuineaParaguayPeruPhilippinesPolandPortugalPost-demographic dividendPre-demographic dividendPuerto RicoQatarRomaniaRussian FederationRwandaSamoaSan MarinoSao Tome and PrincipeSaudi ArabiaSenegalSerbiaSeychellesSierra LeoneSingaporeSint Maarten (Dutch part)Slovak RepublicSloveniaSmall statesSolomon IslandsSomaliaSouth AfricaSouth AsiaSouth Asia (IDA & IBRD)South SudanSpainSri LankaSt. Kitts and NevisSt. LuciaSt. Vincent and the GrenadinesSub-Saharan Africa Sub-Saharan Africa (excluding high income)Sub-Saharan Africa (IDA & IBRD countries)SudanSurinameSwazilandSwedenSwitzerlandSyrian Arab RepublicTajikistanTanzaniaThailandTimor-LesteTogoTongaTrinidad and TobagoTunisiaTurkeyTurkmenistanTurks and Caicos IslandsTuvaluUgandaUkraineUnited Arab EmiratesUnited KingdomUnited StatesUpper middle incomeUruguayUzbekistanVanuatuVenezuela, RBVietnamVirgin Islands (U.S.)West Bank and GazaWorldYemen, Rep.ZambiaZimbabwe Timeline:
This timeline shows a graph from 1972 to 2015 of Benin. No data until 1971. Number of actual observations by date: 43.
Source name:
World Development Indicators
Source organization:
UNESCO Institute for Statistics
Categories, topics:
Education
Last updated:
apr 23, 2017
Indicators value changes by year
Minimum:
155.255K
jan 1, 1972
Maximum:
2.133 mln
jan 1, 2015
At the date of observation
Value
Absolute change
Change from previous value
jan 1, 1972
155.255K
+155.255K
0.0%
jan 1, 1973
173.897K
+18.642K
12.01%
jan 1, 1974
197.851K
+23.954K
13.77%
jan 1, 1975
203.795K
+5.944K
3.0%
jan 1, 1976
244.032K
+40.237K
19.74%
jan 1, 1977
259.88K
+15.848K
6.49%
jan 1, 1978
279.673K
+19.793K
7.62%
jan 1, 1979
293.648K
+13.975K
5.0%
jan 1, 1980
338.948K
+45.3K
15.43%
jan 1, 1981
357.348K
+18.4K
5.43%
jan 1, 1982
379.926K
+22.578K
6.32%
jan 1, 1983
404.297K
+24.371K
6.41%
jan 1, 1984
428.185K
+23.888K
5.91%
jan 1, 1985
429.19K
+1.005K
0.23%
jan 1, 1986
444.232K
+15.042K
3.5%
jan 1, 1987
444.163K
-69.0
-0.02%
jan 1, 1988
462.12K
+17.957K
4.04%
jan 1, 1989
470.277K
+8.157K
1.77%
jan 1, 1990
482.451K
+12.174K
2.59%
jan 1, 1991
418.272K
-64.179K
-13.3%
jan 1, 1992
490.129K
+71.857K
17.18%
jan 1, 1993
534.81K
+44.681K
9.12%
jan 1, 1994
599.83K
+65.02K
12.16%
jan 1, 1995
624.778K
+24.948K
4.16%
jan 1, 1996
677.9K
+53.122K
8.5%
jan 1, 1997
722.161K
+44.261K
6.53%
jan 1, 1998
784.887K
+62.726K
8.69%
jan 1, 1999
843.34K
+58.453K
7.45%
jan 1, 2000
872.217K
+28.877K
3.42%
jan 1, 2001
932.424K
+60.207K
6.9%
jan 1, 2002
1.055 mln
+122.512K
13.14%
jan 1, 2003
1.153 mln
+97.862K
9.28%
jan 1, 2004
1.233 mln
+80.416K
6.98%
jan 1, 2005
1.32 mln
+86.434K
7.01%
jan 1, 2006
1.318 mln
-1.508K
-0.11%
jan 1, 2007
1.357 mln
+38.678K
2.93%
jan 1, 2009
1.601 mln
+244.328K
18.01%
jan 1, 2010
1.719 mln
+118.244K
7.38%
jan 1, 2011
1.788 mln
+68.55K
3.99%
jan 1, 2012
1.869 mln
+81.439K
4.55%
jan 1, 2013
1.987 mln
+117.803K
6.3%
jan 1, 2014
2.064 mln
+76.849K
3.87%
jan 1, 2015
2.133 mln
+69.299K
3.36%
Ranking of countries by current statistics by years


Comments: