29
/
en
AIzaSyAYiBZKx7MnpbEhh9jyipgxe19OcubqV5w
April 1, 2024
166059
Kazakhstan
KAZ
true
2
1
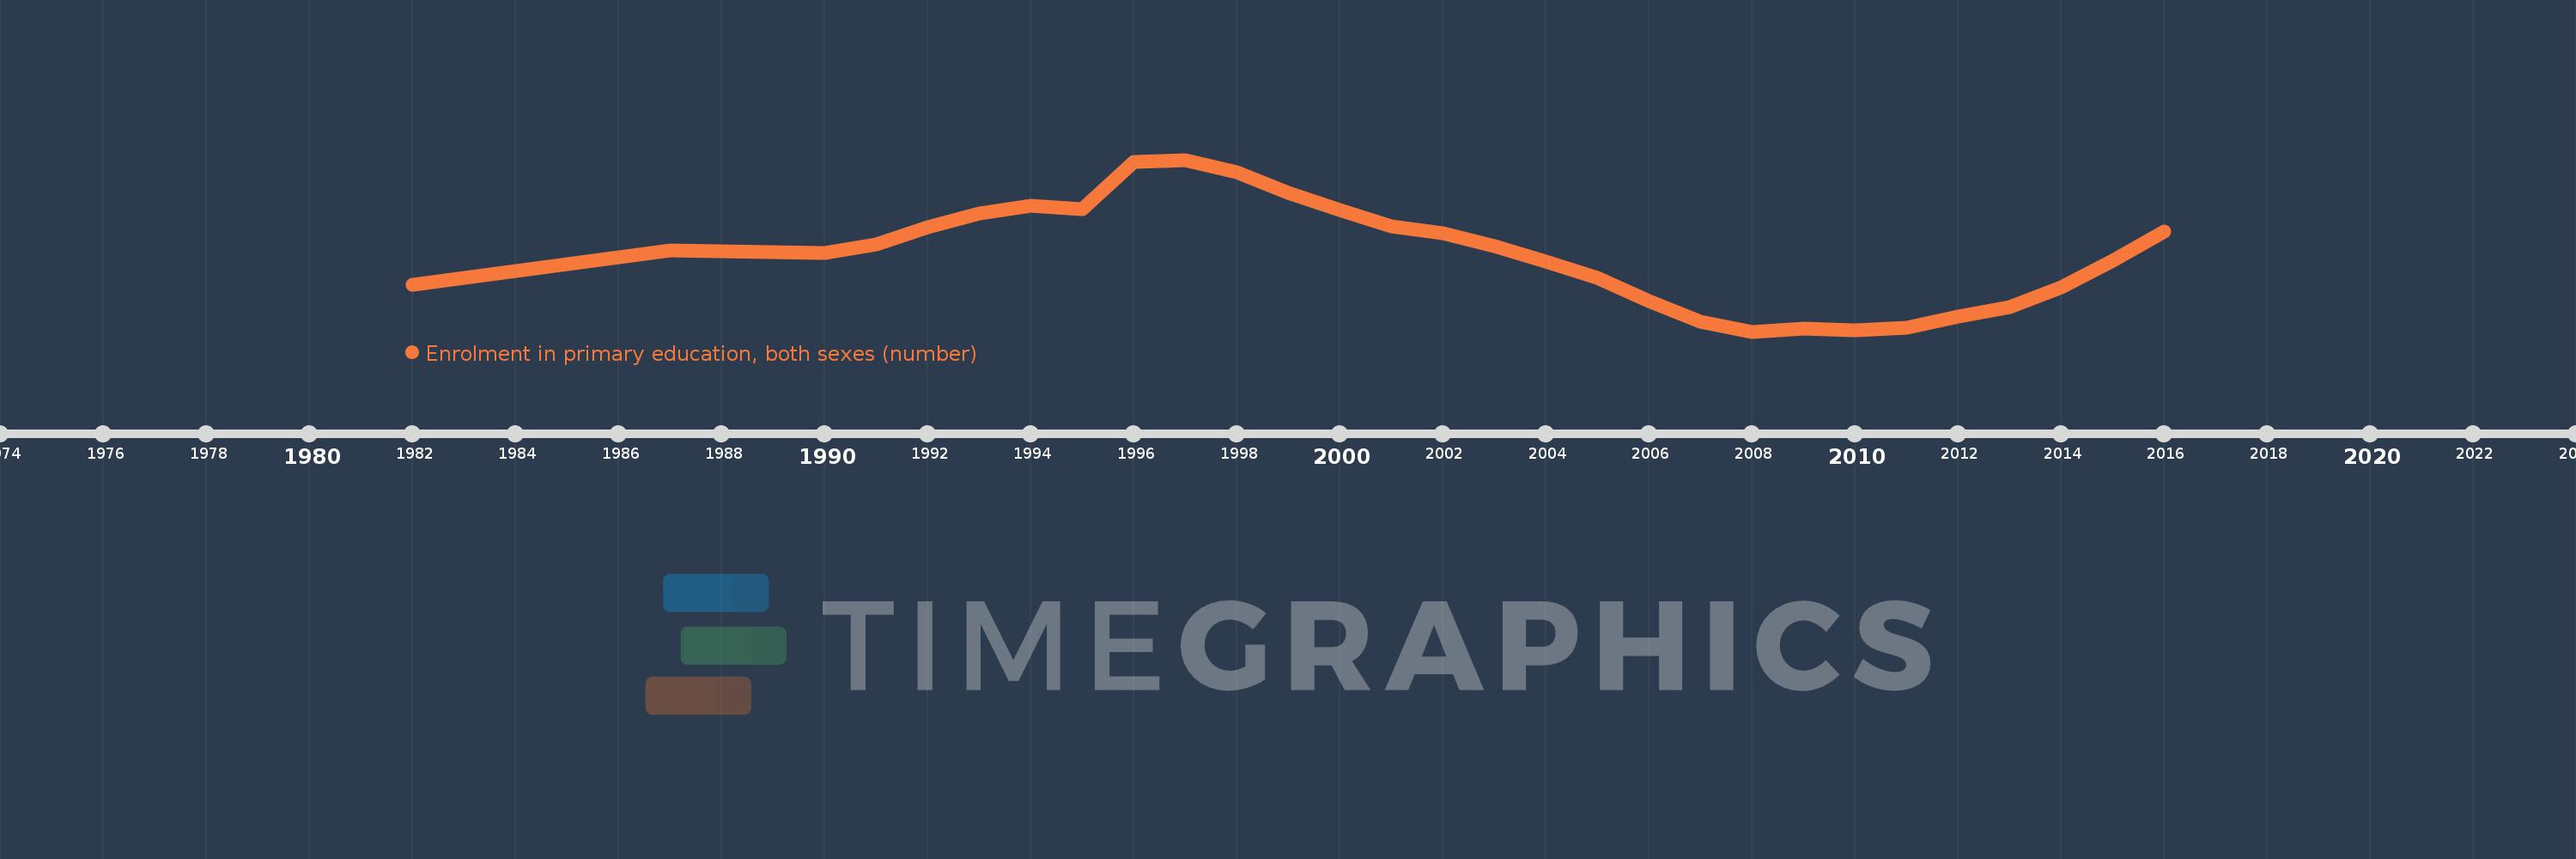
Enrolment in primary education, both sexes (number)
2016,2015,2014,2013,2012,2011,2010,2009,2008,2007,2006,2005,2004,2003,2002,2001,2000,1999,1998,1997,1996,1995,1994,1993,1992,1991,1990,1987,1982
This statistics in other country:
AfghanistanAlbaniaAlgeriaAmerican SamoaAndorraAngolaAntigua and BarbudaArab WorldArgentinaArmeniaArubaAustraliaAustriaAzerbaijanBahamas, TheBahrainBangladeshBarbadosBelarusBelgiumBelizeBeninBermudaBhutanBoliviaBosnia and HerzegovinaBotswanaBrazilBritish Virgin IslandsBrunei DarussalamBulgariaBurkina FasoBurundiCabo VerdeCambodiaCameroonCanadaCaribbean small statesCayman IslandsCentral African RepublicCentral Europe and the BalticsChadChileChinaColombiaComorosCongo, Dem. Rep.Congo, Rep.Costa RicaCote d'IvoireCroatiaCubaCuracaoCyprusCzech RepublicDenmarkDjiboutiDominicaDominican RepublicEarly-demographic dividendEast Asia & PacificEast Asia & Pacific (excluding high income)East Asia & Pacific (IDA & IBRD countries)EcuadorEgypt, Arab Rep.El SalvadorEquatorial GuineaEritreaEstoniaEthiopiaEuro areaEurope & Central AsiaEurope & Central Asia (excluding high income)Europe & Central Asia (IDA & IBRD countries)European UnionFaroe IslandsFijiFinlandFragile and conflict affected situationsFranceFrench PolynesiaGabonGambia, TheGeorgiaGermanyGhanaGibraltarGreeceGrenadaGuamGuatemalaGuineaGuinea-BissauGuyanaHaitiHeavily indebted poor countries (HIPC)High incomeHondurasHong Kong SAR, ChinaHungaryIBRD onlyIcelandIDA & IBRD totalIDA blendIDA onlyIDA totalIndiaIndonesiaIran, Islamic Rep.IraqIrelandIsraelItalyJamaicaJapanJordanKazakhstanKenyaKiribatiKorea, Dem. People’s Rep.Korea, Rep.KuwaitKyrgyz RepublicLao PDRLate-demographic dividendLatin America & Caribbean Latin America & Caribbean (excluding high income)Latin America & the Caribbean (IDA & IBRD countries)LatviaLeast developed countries: UN classificationLebanonLesothoLiberiaLibyaLiechtensteinLithuaniaLow & middle incomeLow incomeLower middle incomeLuxembourgMacao SAR, ChinaMacedonia, FYRMadagascarMalawiMalaysiaMaldivesMaliMaltaMarshall IslandsMauritaniaMauritiusMexicoMicronesia, Fed. Sts.Middle East & North AfricaMiddle East & North Africa (excluding high income)Middle East & North Africa (IDA & IBRD countries)Middle incomeMoldovaMonacoMongoliaMontenegroMoroccoMozambiqueMyanmarNamibiaNauruNepalNetherlandsNew CaledoniaNew ZealandNicaraguaNigerNigeriaNorth AmericaNorwayOECD membersOmanOther small statesPacific island small statesPakistanPalauPanamaPapua New GuineaParaguayPeruPhilippinesPolandPortugalPost-demographic dividendPre-demographic dividendPuerto RicoQatarRomaniaRussian FederationRwandaSamoaSan MarinoSao Tome and PrincipeSaudi ArabiaSenegalSerbiaSeychellesSierra LeoneSingaporeSint Maarten (Dutch part)Slovak RepublicSloveniaSmall statesSolomon IslandsSomaliaSouth AfricaSouth AsiaSouth Asia (IDA & IBRD)South SudanSpainSri LankaSt. Kitts and NevisSt. LuciaSt. Vincent and the GrenadinesSub-Saharan Africa Sub-Saharan Africa (excluding high income)Sub-Saharan Africa (IDA & IBRD countries)SudanSurinameSwazilandSwedenSwitzerlandSyrian Arab RepublicTajikistanTanzaniaThailandTimor-LesteTogoTongaTrinidad and TobagoTunisiaTurkeyTurkmenistanTurks and Caicos IslandsTuvaluUgandaUkraineUnited Arab EmiratesUnited KingdomUnited StatesUpper middle incomeUruguayUzbekistanVanuatuVenezuela, RBVietnamVirgin Islands (U.S.)West Bank and GazaWorldYemen, Rep.ZambiaZimbabwe Timeline:
This timeline shows a graph from 1982 to 2016 of Kazakhstan. No data until 1981. Number of actual observations by date: 29.
Source name:
World Development Indicators
Source organization:
UNESCO Institute for Statistics
Categories, topics:
Education
Last updated:
apr 23, 2017
Indicators value changes by year
Minimum:
947.807K
jan 1, 2008
Maximum:
1.373 mln
jan 1, 1997
At the date of observation
Value
Absolute change
Change from previous value
jan 1, 1982
1.064 mln
+1.064 mln
0.0%
jan 1, 1987
1.148 mln
+83.7K
7.87%
jan 1, 1990
1.142 mln
-5.3K
-0.46%
jan 1, 1991
1.163 mln
+20.377K
1.78%
jan 1, 1992
1.206 mln
+42.795K
3.68%
jan 1, 1993
1.24 mln
+34.245K
2.84%
jan 1, 1994
1.259 mln
+18.712K
1.51%
jan 1, 1995
1.251 mln
-7.418K
-0.59%
jan 1, 1996
1.367 mln
+115.955K
9.27%
jan 1, 1997
1.373 mln
+5.534K
0.4%
jan 1, 1998
1.342 mln
-30.565K
-2.23%
jan 1, 1999
1.291 mln
-51.225K
-3.82%
jan 1, 2000
1.249 mln
-41.91K
-3.25%
jan 1, 2001
1.208 mln
-40.58K
-3.25%
jan 1, 2002
1.19 mln
-18.251K
-1.51%
jan 1, 2003
1.158 mln
-31.77K
-2.67%
jan 1, 2004
1.12 mln
-38.294K
-3.31%
jan 1, 2005
1.08 mln
-40.407K
-3.61%
jan 1, 2006
1.024 mln
-55.624K
-5.15%
jan 1, 2007
972.931K
-51.043K
-4.98%
jan 1, 2008
947.807K
-25.124K
-2.58%
jan 1, 2009
956.019K
+8.212K
0.87%
jan 1, 2010
950.976K
-5.043K
-0.53%
jan 1, 2011
957.919K
+6.943K
0.73%
jan 1, 2012
985.599K
+27.68K
2.89%
jan 1, 2013
1.008 mln
+22.86K
2.32%
jan 1, 2014
1.057 mln
+48.457K
4.81%
jan 1, 2015
1.122 mln
+65.366K
6.18%
jan 1, 2016
1.196 mln
+73.745K
6.57%
Ranking of countries by current statistics by years


Comments: