29
/
en
AIzaSyAYiBZKx7MnpbEhh9jyipgxe19OcubqV5w
April 1, 2024
160412
Israel
ISR
true
2
1
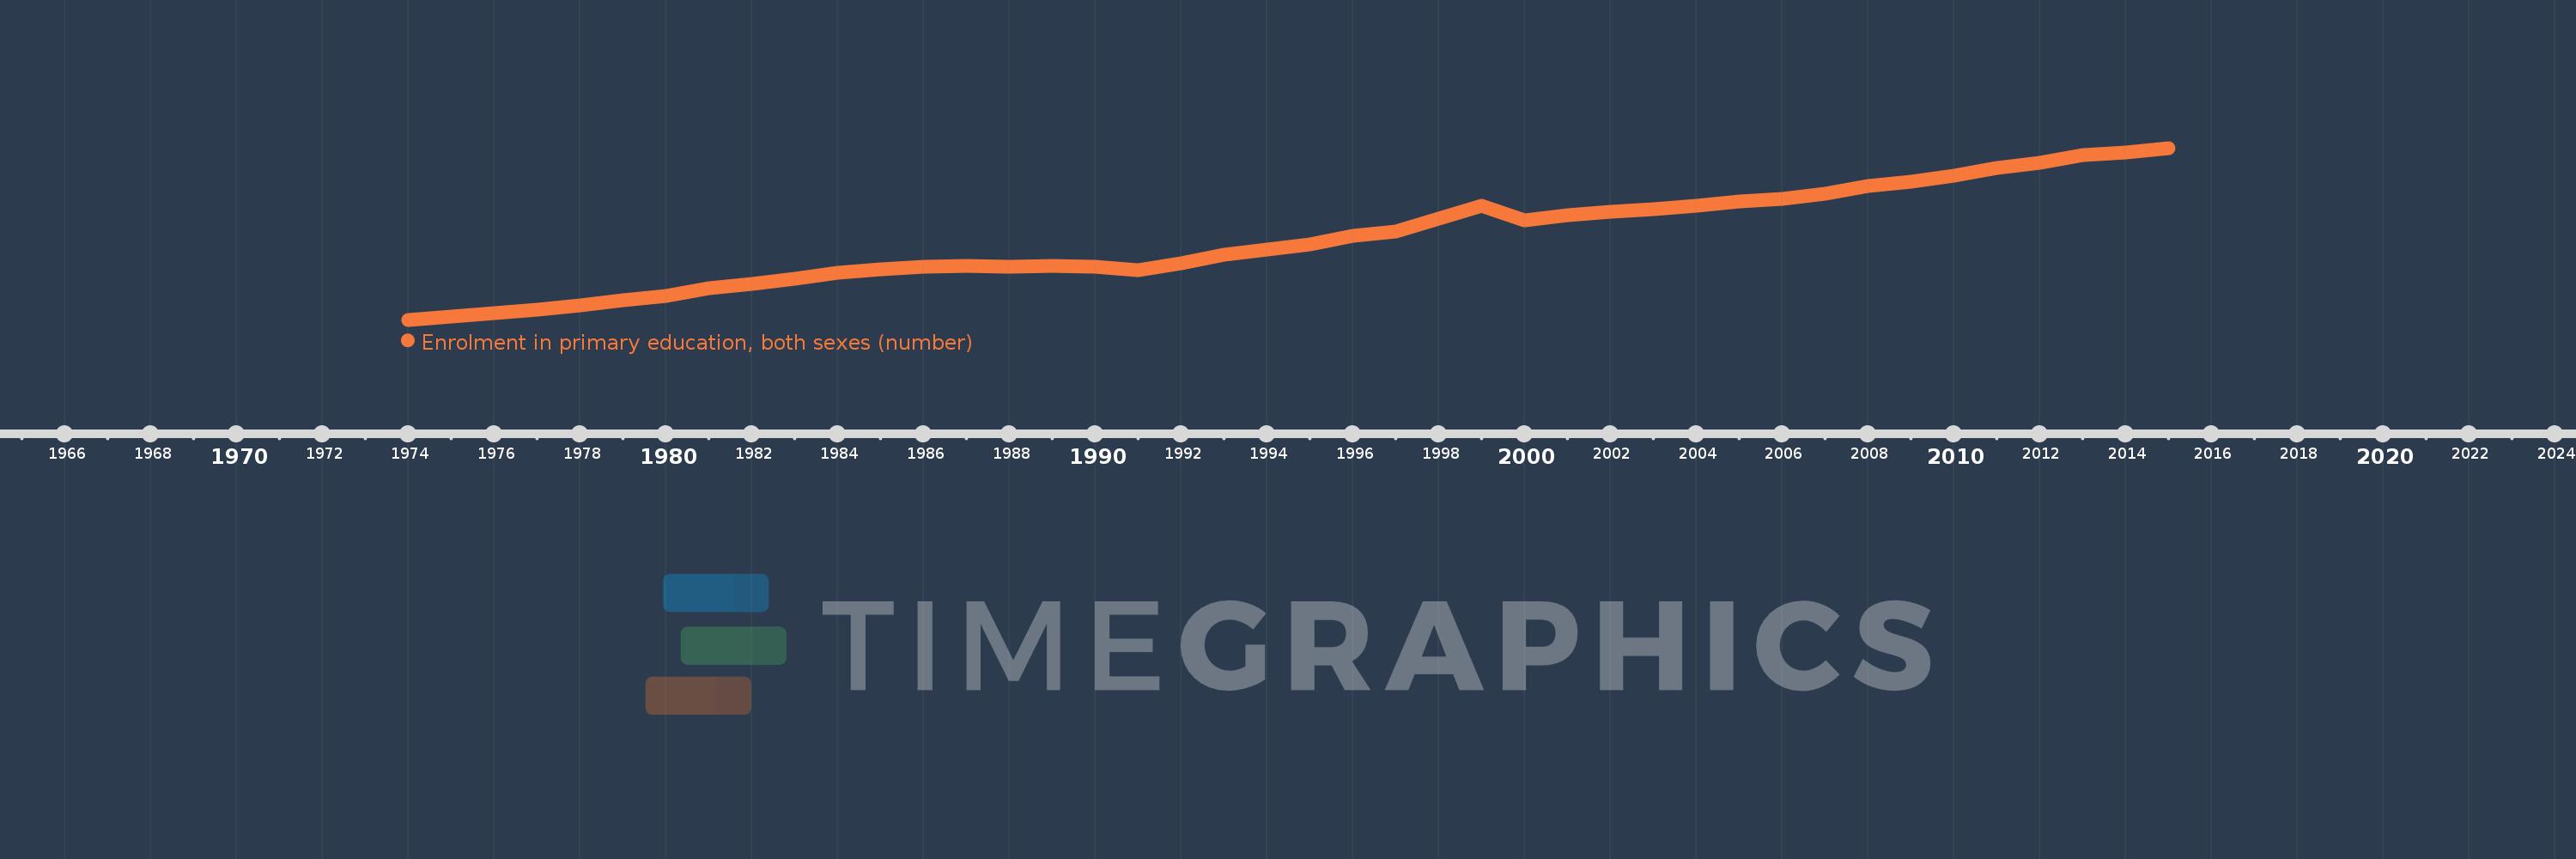
Enrolment in primary education, both sexes (number)
2015,2014,2013,2012,2011,2010,2009,2008,2007,2006,2005,2004,2003,2002,2001,2000,1999,1997,1996,1995,1994,1993,1992,1991,1990,1989,1988,1987,1986,1985,1984,1983,1982,1981,1980,1979,1978,1977,1976,1975,1974
This statistics in other country:
AfghanistanAlbaniaAlgeriaAmerican SamoaAndorraAngolaAntigua and BarbudaArab WorldArgentinaArmeniaArubaAustraliaAustriaAzerbaijanBahamas, TheBahrainBangladeshBarbadosBelarusBelgiumBelizeBeninBermudaBhutanBoliviaBosnia and HerzegovinaBotswanaBrazilBritish Virgin IslandsBrunei DarussalamBulgariaBurkina FasoBurundiCabo VerdeCambodiaCameroonCanadaCaribbean small statesCayman IslandsCentral African RepublicCentral Europe and the BalticsChadChileChinaColombiaComorosCongo, Dem. Rep.Congo, Rep.Costa RicaCote d'IvoireCroatiaCubaCuracaoCyprusCzech RepublicDenmarkDjiboutiDominicaDominican RepublicEarly-demographic dividendEast Asia & PacificEast Asia & Pacific (excluding high income)East Asia & Pacific (IDA & IBRD countries)EcuadorEgypt, Arab Rep.El SalvadorEquatorial GuineaEritreaEstoniaEthiopiaEuro areaEurope & Central AsiaEurope & Central Asia (excluding high income)Europe & Central Asia (IDA & IBRD countries)European UnionFaroe IslandsFijiFinlandFragile and conflict affected situationsFranceFrench PolynesiaGabonGambia, TheGeorgiaGermanyGhanaGibraltarGreeceGrenadaGuamGuatemalaGuineaGuinea-BissauGuyanaHaitiHeavily indebted poor countries (HIPC)High incomeHondurasHong Kong SAR, ChinaHungaryIBRD onlyIcelandIDA & IBRD totalIDA blendIDA onlyIDA totalIndiaIndonesiaIran, Islamic Rep.IraqIrelandIsraelItalyJamaicaJapanJordanKazakhstanKenyaKiribatiKorea, Dem. People’s Rep.Korea, Rep.KuwaitKyrgyz RepublicLao PDRLate-demographic dividendLatin America & Caribbean Latin America & Caribbean (excluding high income)Latin America & the Caribbean (IDA & IBRD countries)LatviaLeast developed countries: UN classificationLebanonLesothoLiberiaLibyaLiechtensteinLithuaniaLow & middle incomeLow incomeLower middle incomeLuxembourgMacao SAR, ChinaMacedonia, FYRMadagascarMalawiMalaysiaMaldivesMaliMaltaMarshall IslandsMauritaniaMauritiusMexicoMicronesia, Fed. Sts.Middle East & North AfricaMiddle East & North Africa (excluding high income)Middle East & North Africa (IDA & IBRD countries)Middle incomeMoldovaMonacoMongoliaMontenegroMoroccoMozambiqueMyanmarNamibiaNauruNepalNetherlandsNew CaledoniaNew ZealandNicaraguaNigerNigeriaNorth AmericaNorwayOECD membersOmanOther small statesPacific island small statesPakistanPalauPanamaPapua New GuineaParaguayPeruPhilippinesPolandPortugalPost-demographic dividendPre-demographic dividendPuerto RicoQatarRomaniaRussian FederationRwandaSamoaSan MarinoSao Tome and PrincipeSaudi ArabiaSenegalSerbiaSeychellesSierra LeoneSingaporeSint Maarten (Dutch part)Slovak RepublicSloveniaSmall statesSolomon IslandsSomaliaSouth AfricaSouth AsiaSouth Asia (IDA & IBRD)South SudanSpainSri LankaSt. Kitts and NevisSt. LuciaSt. Vincent and the GrenadinesSub-Saharan Africa Sub-Saharan Africa (excluding high income)Sub-Saharan Africa (IDA & IBRD countries)SudanSurinameSwazilandSwedenSwitzerlandSyrian Arab RepublicTajikistanTanzaniaThailandTimor-LesteTogoTongaTrinidad and TobagoTunisiaTurkeyTurkmenistanTurks and Caicos IslandsTuvaluUgandaUkraineUnited Arab EmiratesUnited KingdomUnited StatesUpper middle incomeUruguayUzbekistanVanuatuVenezuela, RBVietnamVirgin Islands (U.S.)West Bank and GazaWorldYemen, Rep.ZambiaZimbabwe Timeline:
This timeline shows a graph from 1974 to 2015 of Israel. No data until 1973. Number of actual observations by date: 41.
Source name:
World Development Indicators
Source organization:
UNESCO Institute for Statistics
Categories, topics:
Education
Last updated:
apr 23, 2017
Indicators value changes by year
Minimum:
388.057K
jan 1, 1974
Maximum:
861.699K
jan 1, 2015
At the date of observation
Value
Absolute change
Change from previous value
jan 1, 1974
388.057K
+388.057K
0.0%
jan 1, 1975
396.193K
+8.136K
2.1%
jan 1, 1976
405.759K
+9.566K
2.41%
jan 1, 1977
416.206K
+10.447K
2.57%
jan 1, 1978
427.923K
+11.717K
2.82%
jan 1, 1979
441.226K
+13.303K
3.11%
jan 1, 1980
452.905K
+11.679K
2.65%
jan 1, 1981
474.427K
+21.522K
4.75%
jan 1, 1982
487.345K
+12.918K
2.72%
jan 1, 1983
500.721K
+13.376K
2.74%
jan 1, 1984
517.174K
+16.453K
3.29%
jan 1, 1985
527.968K
+10.794K
2.09%
jan 1, 1986
534.025K
+6.057K
1.15%
jan 1, 1987
537.547K
+3.522K
0.66%
jan 1, 1988
534.514K
-3.033K
-0.56%
jan 1, 1989
537.493K
+2.979K
0.56%
jan 1, 1990
533.635K
-3.858K
-0.72%
jan 1, 1991
525.606K
-8.029K
-1.5%
jan 1, 1992
544.748K
+19.142K
3.64%
jan 1, 1993
567.496K
+22.748K
4.18%
jan 1, 1994
582.504K
+15.008K
2.64%
jan 1, 1995
595.525K
+13.021K
2.24%
jan 1, 1996
618.513K
+22.988K
3.86%
jan 1, 1997
631.916K
+13.403K
2.17%
jan 1, 1999
702.637K
+70.721K
11.19%
jan 1, 2000
662.329K
-40.308K
-5.74%
jan 1, 2001
676.676K
+14.347K
2.17%
jan 1, 2002
684.986K
+8.31K
1.23%
jan 1, 2003
693.567K
+8.581K
1.25%
jan 1, 2004
702.128K
+8.561K
1.23%
jan 1, 2005
714.41K
+12.282K
1.75%
jan 1, 2006
721.999K
+7.589K
1.06%
jan 1, 2007
736.255K
+14.256K
1.97%
jan 1, 2008
757.809K
+21.554K
2.93%
jan 1, 2009
769.328K
+11.519K
1.52%
jan 1, 2010
786.094K
+16.766K
2.18%
jan 1, 2011
807.424K
+21.33K
2.71%
jan 1, 2012
821.481K
+14.057K
1.74%
jan 1, 2013
842.079K
+20.598K
2.51%
jan 1, 2014
848.721K
+6.642K
0.79%
jan 1, 2015
861.699K
+12.978K
1.53%
Ranking of countries by current statistics by years


Comments: