29
/
en
AIzaSyAYiBZKx7MnpbEhh9jyipgxe19OcubqV5w
April 1, 2024
164750
Jordan
JOR
true
2
1
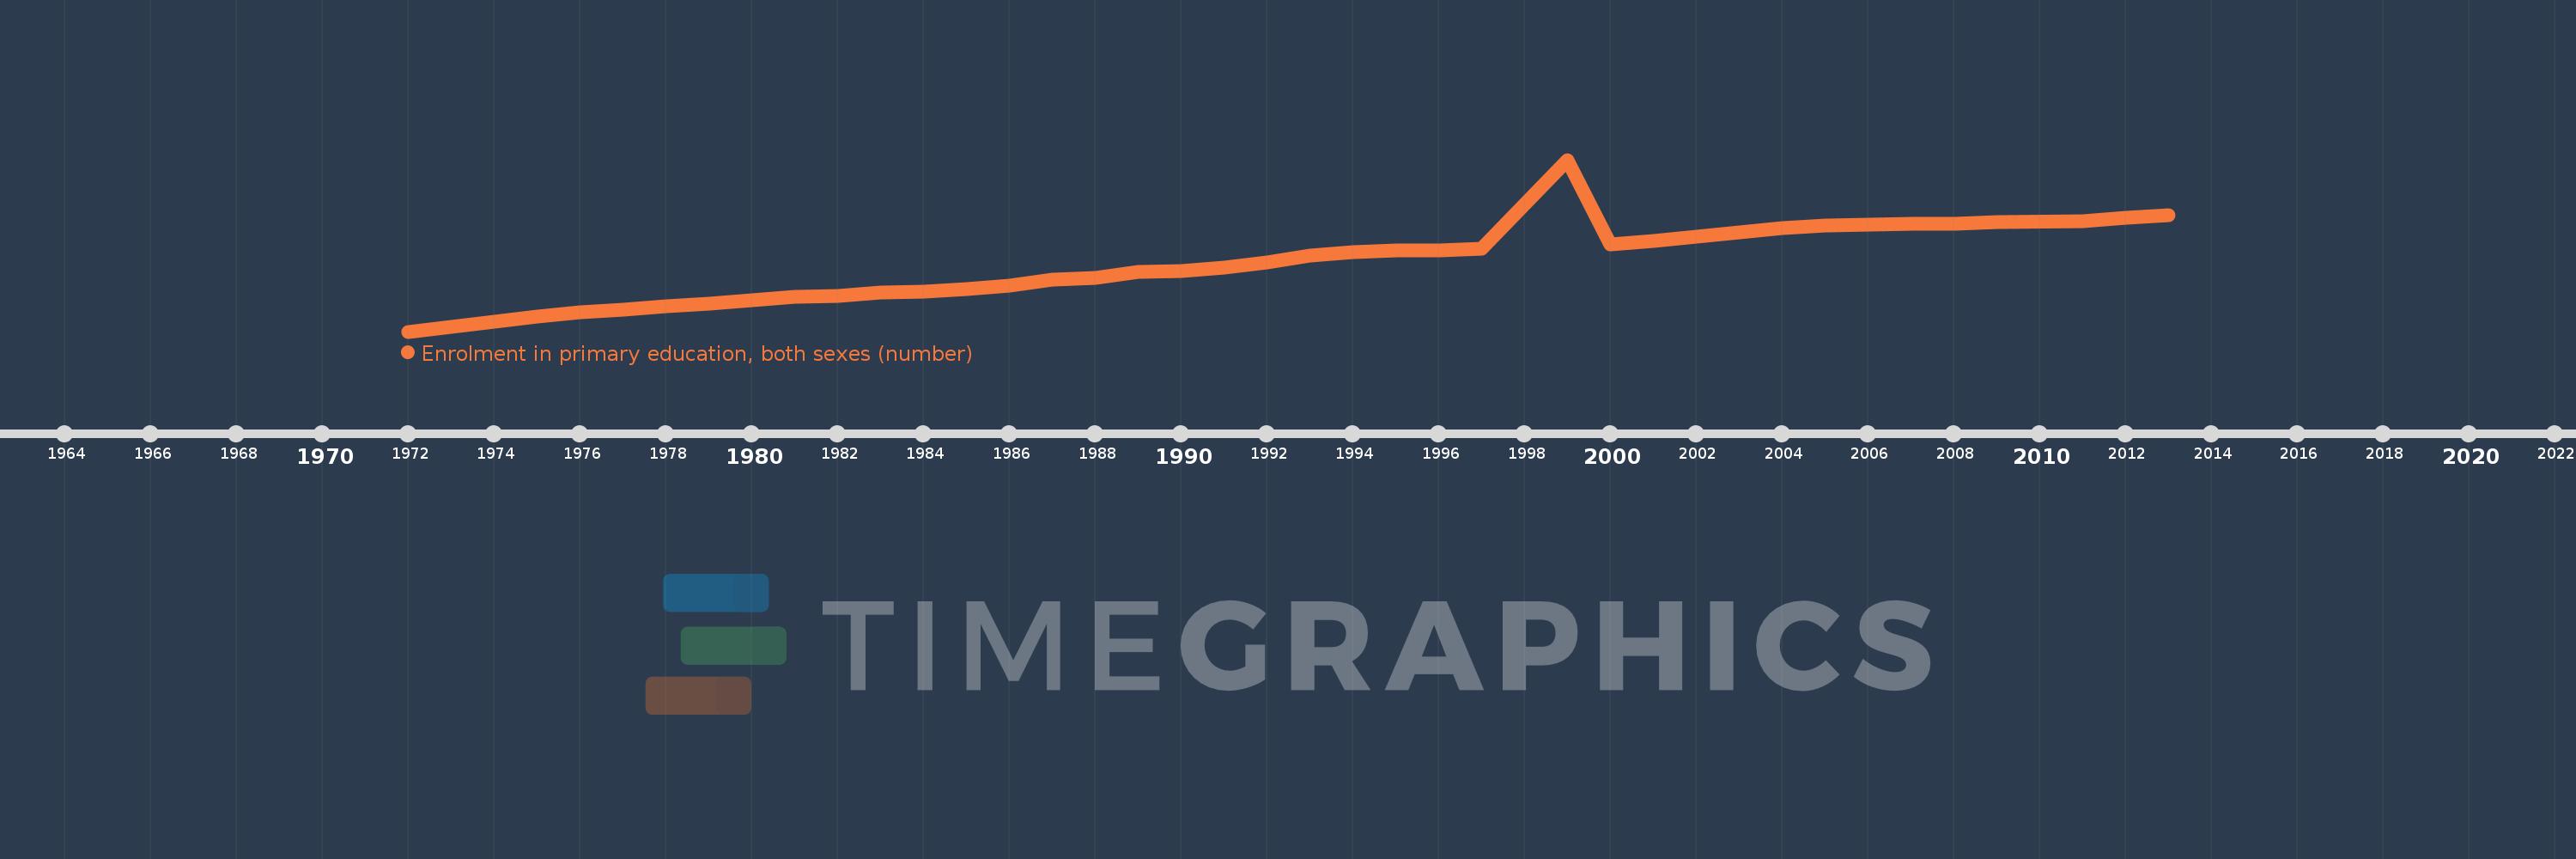
Enrolment in primary education, both sexes (number)
2013,2012,2011,2009,2008,2007,2006,2005,2004,2003,2001,2000,1999,1997,1996,1995,1994,1993,1992,1991,1990,1989,1988,1987,1986,1985,1984,1983,1982,1981,1980,1979,1978,1977,1976,1975,1974,1973,1972
This statistics in other country:
AfghanistanAlbaniaAlgeriaAmerican SamoaAndorraAngolaAntigua and BarbudaArab WorldArgentinaArmeniaArubaAustraliaAustriaAzerbaijanBahamas, TheBahrainBangladeshBarbadosBelarusBelgiumBelizeBeninBermudaBhutanBoliviaBosnia and HerzegovinaBotswanaBrazilBritish Virgin IslandsBrunei DarussalamBulgariaBurkina FasoBurundiCabo VerdeCambodiaCameroonCanadaCaribbean small statesCayman IslandsCentral African RepublicCentral Europe and the BalticsChadChileChinaColombiaComorosCongo, Dem. Rep.Congo, Rep.Costa RicaCote d'IvoireCroatiaCubaCuracaoCyprusCzech RepublicDenmarkDjiboutiDominicaDominican RepublicEarly-demographic dividendEast Asia & PacificEast Asia & Pacific (excluding high income)East Asia & Pacific (IDA & IBRD countries)EcuadorEgypt, Arab Rep.El SalvadorEquatorial GuineaEritreaEstoniaEthiopiaEuro areaEurope & Central AsiaEurope & Central Asia (excluding high income)Europe & Central Asia (IDA & IBRD countries)European UnionFaroe IslandsFijiFinlandFragile and conflict affected situationsFranceFrench PolynesiaGabonGambia, TheGeorgiaGermanyGhanaGibraltarGreeceGrenadaGuamGuatemalaGuineaGuinea-BissauGuyanaHaitiHeavily indebted poor countries (HIPC)High incomeHondurasHong Kong SAR, ChinaHungaryIBRD onlyIcelandIDA & IBRD totalIDA blendIDA onlyIDA totalIndiaIndonesiaIran, Islamic Rep.IraqIrelandIsraelItalyJamaicaJapanJordanKazakhstanKenyaKiribatiKorea, Dem. People’s Rep.Korea, Rep.KuwaitKyrgyz RepublicLao PDRLate-demographic dividendLatin America & Caribbean Latin America & Caribbean (excluding high income)Latin America & the Caribbean (IDA & IBRD countries)LatviaLeast developed countries: UN classificationLebanonLesothoLiberiaLibyaLiechtensteinLithuaniaLow & middle incomeLow incomeLower middle incomeLuxembourgMacao SAR, ChinaMacedonia, FYRMadagascarMalawiMalaysiaMaldivesMaliMaltaMarshall IslandsMauritaniaMauritiusMexicoMicronesia, Fed. Sts.Middle East & North AfricaMiddle East & North Africa (excluding high income)Middle East & North Africa (IDA & IBRD countries)Middle incomeMoldovaMonacoMongoliaMontenegroMoroccoMozambiqueMyanmarNamibiaNauruNepalNetherlandsNew CaledoniaNew ZealandNicaraguaNigerNigeriaNorth AmericaNorwayOECD membersOmanOther small statesPacific island small statesPakistanPalauPanamaPapua New GuineaParaguayPeruPhilippinesPolandPortugalPost-demographic dividendPre-demographic dividendPuerto RicoQatarRomaniaRussian FederationRwandaSamoaSan MarinoSao Tome and PrincipeSaudi ArabiaSenegalSerbiaSeychellesSierra LeoneSingaporeSint Maarten (Dutch part)Slovak RepublicSloveniaSmall statesSolomon IslandsSomaliaSouth AfricaSouth AsiaSouth Asia (IDA & IBRD)South SudanSpainSri LankaSt. Kitts and NevisSt. LuciaSt. Vincent and the GrenadinesSub-Saharan Africa Sub-Saharan Africa (excluding high income)Sub-Saharan Africa (IDA & IBRD countries)SudanSurinameSwazilandSwedenSwitzerlandSyrian Arab RepublicTajikistanTanzaniaThailandTimor-LesteTogoTongaTrinidad and TobagoTunisiaTurkeyTurkmenistanTurks and Caicos IslandsTuvaluUgandaUkraineUnited Arab EmiratesUnited KingdomUnited StatesUpper middle incomeUruguayUzbekistanVanuatuVenezuela, RBVietnamVirgin Islands (U.S.)West Bank and GazaWorldYemen, Rep.ZambiaZimbabwe Timeline:
This timeline shows a graph from 1972 to 2013 of Jordan. No data until 1971. Number of actual observations by date: 39.
Source name:
World Development Indicators
Source organization:
UNESCO Institute for Statistics
Categories, topics:
Education
Last updated:
apr 23, 2017
Indicators value changes by year
Minimum:
277.619K
jan 1, 1972
Maximum:
1.122 mln
jan 1, 1999
At the date of observation
Value
Absolute change
Change from previous value
jan 1, 1972
277.619K
+277.619K
0.0%
jan 1, 1973
298.802K
+21.183K
7.63%
jan 1, 1974
326.111K
+27.309K
9.14%
jan 1, 1975
352.696K
+26.585K
8.15%
jan 1, 1976
371.631K
+18.935K
5.37%
jan 1, 1977
386.012K
+14.381K
3.87%
jan 1, 1978
402.401K
+16.389K
4.25%
jan 1, 1979
414.49K
+12.089K
3.0%
jan 1, 1980
431.107K
+16.617K
4.01%
jan 1, 1981
448.411K
+17.304K
4.01%
jan 1, 1982
454.391K
+5.98K
1.33%
jan 1, 1983
467.696K
+13.305K
2.93%
jan 1, 1984
473.027K
+5.331K
1.14%
jan 1, 1985
487.89K
+14.863K
3.14%
jan 1, 1986
504.226K
+16.336K
3.35%
jan 1, 1987
530.906K
+26.68K
5.29%
jan 1, 1988
542.519K
+11.613K
2.19%
jan 1, 1989
570.795K
+28.276K
5.21%
jan 1, 1990
575.464K
+4.669K
0.82%
jan 1, 1991
590.275K
+14.811K
2.57%
jan 1, 1992
618.274K
+27.999K
4.74%
jan 1, 1993
651.783K
+33.509K
5.42%
jan 1, 1994
669.755K
+17.972K
2.76%
jan 1, 1995
675.316K
+5.561K
0.83%
jan 1, 1996
677.945K
+2.629K
0.39%
jan 1, 1997
683.4K
+5.455K
0.8%
jan 1, 1999
1.122 mln
+438.466K
64.16%
jan 1, 2000
706.198K
-415.668K
-37.05%
jan 1, 2001
723.508K
+17.31K
2.45%
jan 1, 2003
766.093K
+42.585K
5.89%
jan 1, 2004
786.154K
+20.061K
2.62%
jan 1, 2005
799.888K
+13.734K
1.75%
jan 1, 2006
804.904K
+5.016K
0.63%
jan 1, 2007
805.457K
+553.0
0.07%
jan 1, 2008
807.702K
+2.245K
0.28%
jan 1, 2009
817.16K
+9.458K
1.17%
jan 1, 2011
819.601K
+2.441K
0.3%
jan 1, 2012
834.958K
+15.357K
1.87%
jan 1, 2013
849.39K
+14.432K
1.73%
Ranking of countries by current statistics by years


Comments: