29
/
en
AIzaSyAYiBZKx7MnpbEhh9jyipgxe19OcubqV5w
April 1, 2024
282202
Vietnam
VNM
true
2
1
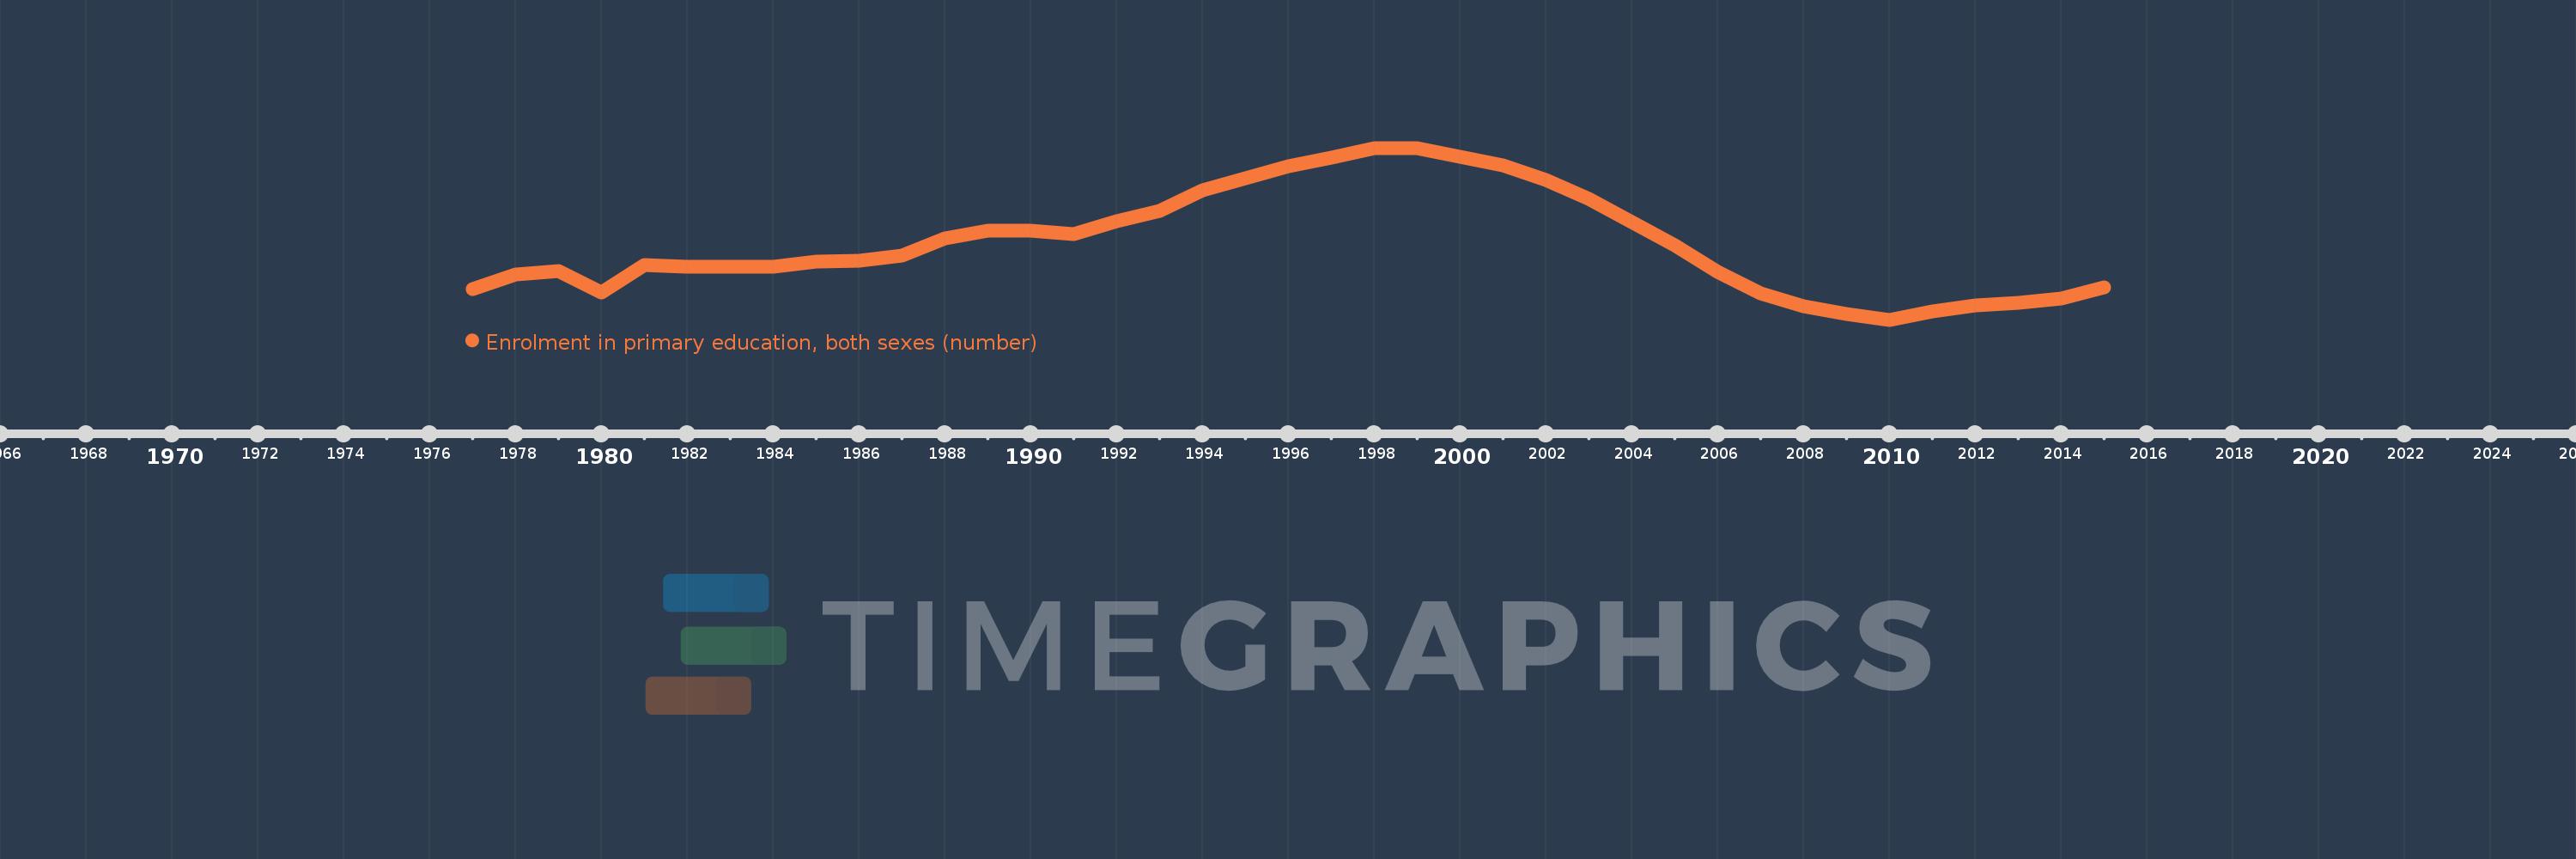
Enrolment in primary education, both sexes (number)
2015,2014,2013,2012,2011,2010,2009,2008,2007,2006,2005,2004,2003,2002,2001,2000,1999,1998,1997,1996,1995,1994,1993,1992,1991,1990,1989,1988,1987,1986,1985,1984,1982,1981,1980,1979,1978,1977
This statistics in other country:
AfghanistanAlbaniaAlgeriaAmerican SamoaAndorraAngolaAntigua and BarbudaArab WorldArgentinaArmeniaArubaAustraliaAustriaAzerbaijanBahamas, TheBahrainBangladeshBarbadosBelarusBelgiumBelizeBeninBermudaBhutanBoliviaBosnia and HerzegovinaBotswanaBrazilBritish Virgin IslandsBrunei DarussalamBulgariaBurkina FasoBurundiCabo VerdeCambodiaCameroonCanadaCaribbean small statesCayman IslandsCentral African RepublicCentral Europe and the BalticsChadChileChinaColombiaComorosCongo, Dem. Rep.Congo, Rep.Costa RicaCote d'IvoireCroatiaCubaCuracaoCyprusCzech RepublicDenmarkDjiboutiDominicaDominican RepublicEarly-demographic dividendEast Asia & PacificEast Asia & Pacific (excluding high income)East Asia & Pacific (IDA & IBRD countries)EcuadorEgypt, Arab Rep.El SalvadorEquatorial GuineaEritreaEstoniaEthiopiaEuro areaEurope & Central AsiaEurope & Central Asia (excluding high income)Europe & Central Asia (IDA & IBRD countries)European UnionFaroe IslandsFijiFinlandFragile and conflict affected situationsFranceFrench PolynesiaGabonGambia, TheGeorgiaGermanyGhanaGibraltarGreeceGrenadaGuamGuatemalaGuineaGuinea-BissauGuyanaHaitiHeavily indebted poor countries (HIPC)High incomeHondurasHong Kong SAR, ChinaHungaryIBRD onlyIcelandIDA & IBRD totalIDA blendIDA onlyIDA totalIndiaIndonesiaIran, Islamic Rep.IraqIrelandIsraelItalyJamaicaJapanJordanKazakhstanKenyaKiribatiKorea, Dem. People’s Rep.Korea, Rep.KuwaitKyrgyz RepublicLao PDRLate-demographic dividendLatin America & Caribbean Latin America & Caribbean (excluding high income)Latin America & the Caribbean (IDA & IBRD countries)LatviaLeast developed countries: UN classificationLebanonLesothoLiberiaLibyaLiechtensteinLithuaniaLow & middle incomeLow incomeLower middle incomeLuxembourgMacao SAR, ChinaMacedonia, FYRMadagascarMalawiMalaysiaMaldivesMaliMaltaMarshall IslandsMauritaniaMauritiusMexicoMicronesia, Fed. Sts.Middle East & North AfricaMiddle East & North Africa (excluding high income)Middle East & North Africa (IDA & IBRD countries)Middle incomeMoldovaMonacoMongoliaMontenegroMoroccoMozambiqueMyanmarNamibiaNauruNepalNetherlandsNew CaledoniaNew ZealandNicaraguaNigerNigeriaNorth AmericaNorwayOECD membersOmanOther small statesPacific island small statesPakistanPalauPanamaPapua New GuineaParaguayPeruPhilippinesPolandPortugalPost-demographic dividendPre-demographic dividendPuerto RicoQatarRomaniaRussian FederationRwandaSamoaSan MarinoSao Tome and PrincipeSaudi ArabiaSenegalSerbiaSeychellesSierra LeoneSingaporeSint Maarten (Dutch part)Slovak RepublicSloveniaSmall statesSolomon IslandsSomaliaSouth AfricaSouth AsiaSouth Asia (IDA & IBRD)South SudanSpainSri LankaSt. Kitts and NevisSt. LuciaSt. Vincent and the GrenadinesSub-Saharan Africa Sub-Saharan Africa (excluding high income)Sub-Saharan Africa (IDA & IBRD countries)SudanSurinameSwazilandSwedenSwitzerlandSyrian Arab RepublicTajikistanTanzaniaThailandTimor-LesteTogoTongaTrinidad and TobagoTunisiaTurkeyTurkmenistanTurks and Caicos IslandsTuvaluUgandaUkraineUnited Arab EmiratesUnited KingdomUnited StatesUpper middle incomeUruguayUzbekistanVanuatuVenezuela, RBVietnamVirgin Islands (U.S.)West Bank and GazaWorldYemen, Rep.ZambiaZimbabwe Timeline:
This timeline shows a graph from 1977 to 2015 of Vietnam. No data until 1976. Number of actual observations by date: 38.
Source name:
World Development Indicators
Source organization:
UNESCO Institute for Statistics
Categories, topics:
Education
Last updated:
apr 23, 2017
Indicators value changes by year
Minimum:
6.745 mln
jan 1, 2010
Maximum:
10.436 mln
jan 1, 1999
At the date of observation
Value
Absolute change
Change from previous value
jan 1, 1977
7.404 mln
+7.404 mln
0.0%
jan 1, 1978
7.723 mln
+318.809K
4.31%
jan 1, 1979
7.785 mln
+62.063K
0.8%
jan 1, 1980
7.337 mln
-447.151K
-5.74%
jan 1, 1981
7.923 mln
+586.059K
7.99%
jan 1, 1982
7.887 mln
-36.056K
-0.46%
jan 1, 1984
7.884 mln
-3.237K
-0.04%
jan 1, 1985
7.993 mln
+108.817K
1.38%
jan 1, 1986
8.006 mln
+12.962K
0.16%
jan 1, 1987
8.126 mln
+119.855K
1.5%
jan 1, 1988
8.485 mln
+358.849K
4.42%
jan 1, 1989
8.666 mln
+181.567K
2.14%
jan 1, 1990
8.663 mln
-2.771K
-0.03%
jan 1, 1991
8.583 mln
-80.429K
-0.93%
jan 1, 1992
8.862 mln
+279.24K
3.25%
jan 1, 1993
9.091 mln
+228.508K
2.58%
jan 1, 1994
9.527 mln
+436.4K
4.8%
jan 1, 1995
9.783 mln
+255.7K
2.68%
jan 1, 1996
10.048 mln
+264.664K
2.71%
jan 1, 1997
10.229 mln
+181.236K
1.8%
jan 1, 1998
10.431 mln
+202.5K
1.98%
jan 1, 1999
10.436 mln
+4.208K
0.04%
jan 1, 2000
10.25 mln
-185.294K
-1.78%
jan 1, 2001
10.063 mln
-187.189K
-1.83%
jan 1, 2002
9.751 mln
-311.591K
-3.1%
jan 1, 2003
9.337 mln
-414.521K
-4.25%
jan 1, 2004
8.841 mln
-495.909K
-5.31%
jan 1, 2005
8.35 mln
-490.813K
-5.55%
jan 1, 2006
7.773 mln
-576.707K
-6.91%
jan 1, 2007
7.318 mln
-455.671K
-5.86%
jan 1, 2008
7.041 mln
-276.501K
-3.78%
jan 1, 2009
6.872 mln
-169.517K
-2.41%
jan 1, 2010
6.745 mln
-126.779K
-1.84%
jan 1, 2011
6.923 mln
+177.608K
2.63%
jan 1, 2012
7.048 mln
+125.869K
1.82%
jan 1, 2013
7.101 mln
+52.457K
0.74%
jan 1, 2014
7.203 mln
+101.817K
1.43%
jan 1, 2015
7.435 mln
+232.081K
3.22%
Ranking of countries by current statistics by years


Comments: