29
/
en
AIzaSyAYiBZKx7MnpbEhh9jyipgxe19OcubqV5w
April 1, 2024
194137
Mauritius
MUS
true
2
1
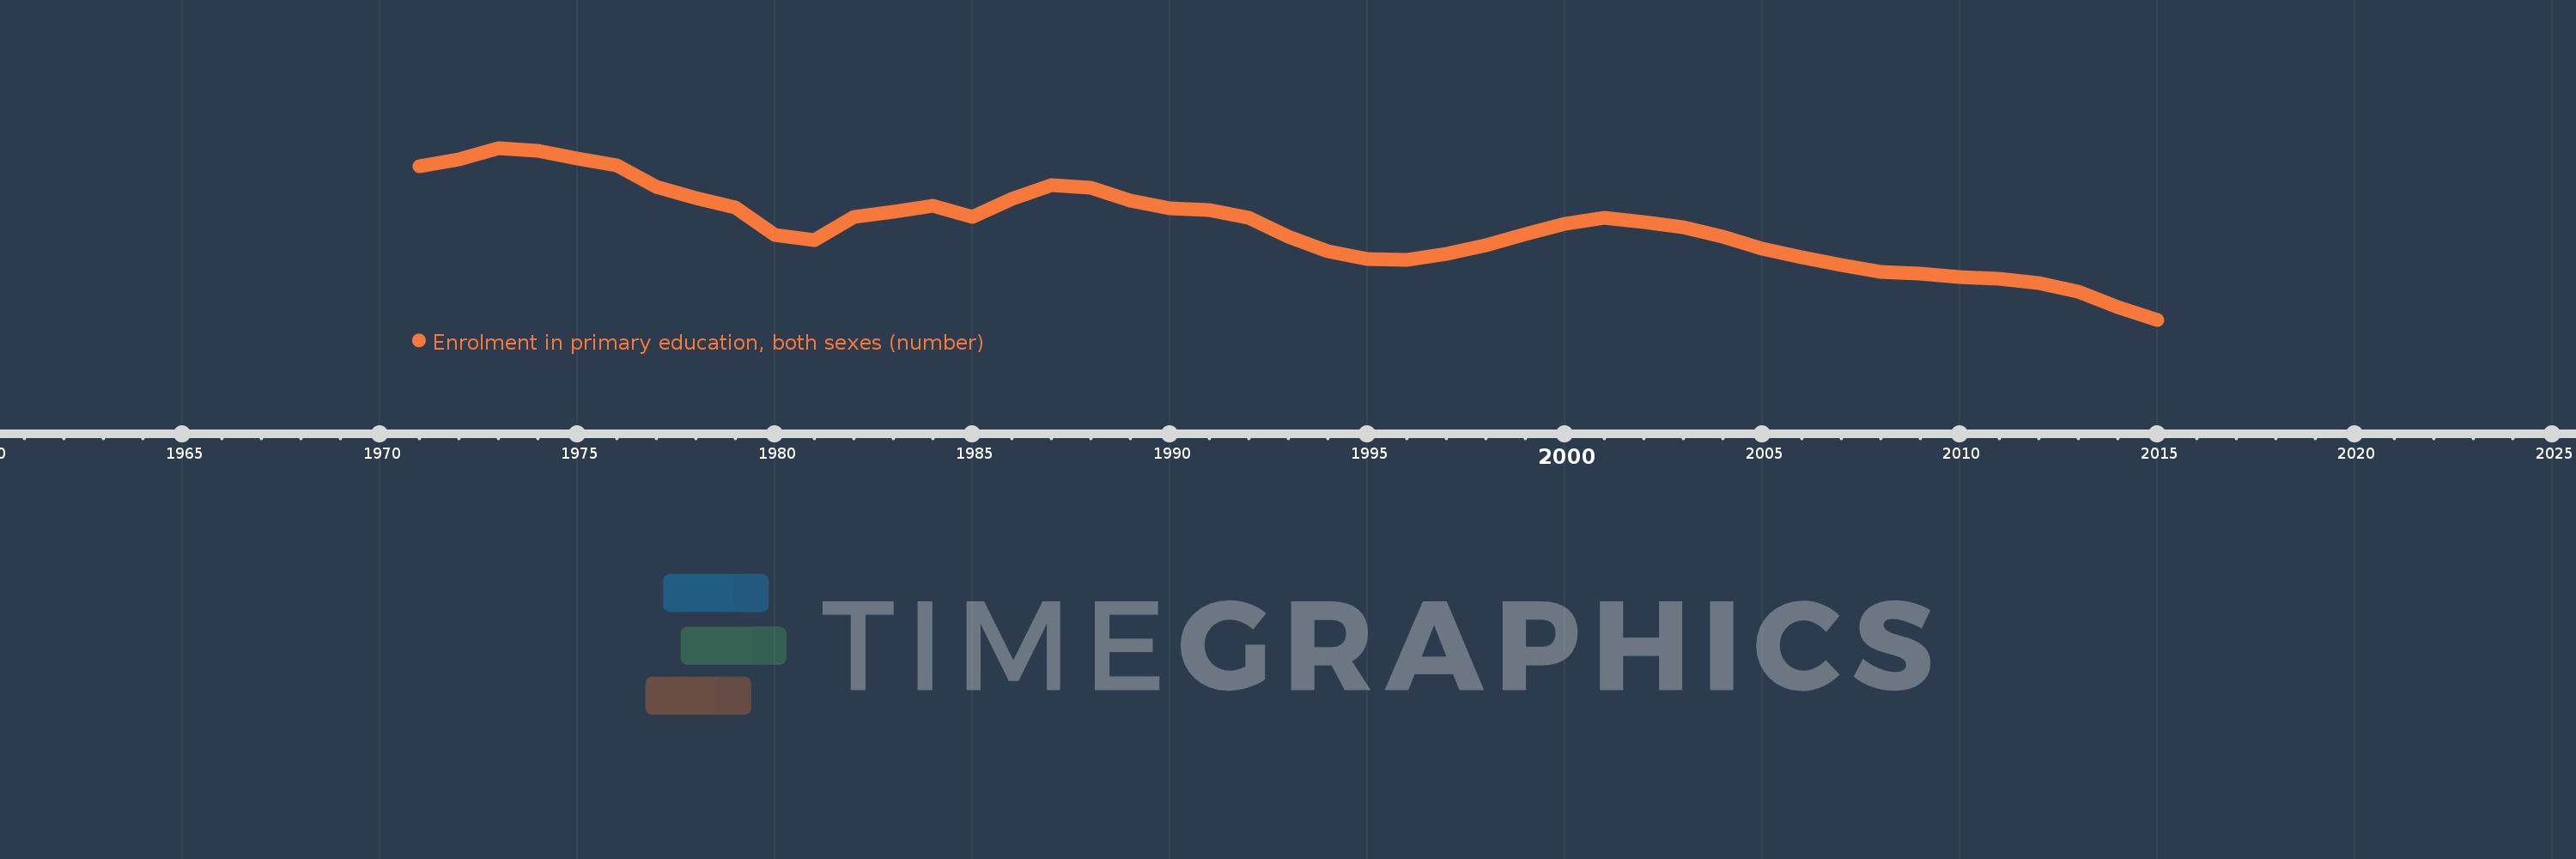
Enrolment in primary education, both sexes (number)
2015,2014,2013,2012,2011,2010,2009,2008,2007,2006,2005,2004,2003,2002,2001,2000,1999,1998,1997,1996,1995,1994,1993,1992,1991,1990,1989,1988,1987,1986,1985,1984,1983,1982,1981,1980,1979,1978,1977,1976,1975,1974,1973,1972,1971
This statistics in other country:
AfghanistanAlbaniaAlgeriaAmerican SamoaAndorraAngolaAntigua and BarbudaArab WorldArgentinaArmeniaArubaAustraliaAustriaAzerbaijanBahamas, TheBahrainBangladeshBarbadosBelarusBelgiumBelizeBeninBermudaBhutanBoliviaBosnia and HerzegovinaBotswanaBrazilBritish Virgin IslandsBrunei DarussalamBulgariaBurkina FasoBurundiCabo VerdeCambodiaCameroonCanadaCaribbean small statesCayman IslandsCentral African RepublicCentral Europe and the BalticsChadChileChinaColombiaComorosCongo, Dem. Rep.Congo, Rep.Costa RicaCote d'IvoireCroatiaCubaCuracaoCyprusCzech RepublicDenmarkDjiboutiDominicaDominican RepublicEarly-demographic dividendEast Asia & PacificEast Asia & Pacific (excluding high income)East Asia & Pacific (IDA & IBRD countries)EcuadorEgypt, Arab Rep.El SalvadorEquatorial GuineaEritreaEstoniaEthiopiaEuro areaEurope & Central AsiaEurope & Central Asia (excluding high income)Europe & Central Asia (IDA & IBRD countries)European UnionFaroe IslandsFijiFinlandFragile and conflict affected situationsFranceFrench PolynesiaGabonGambia, TheGeorgiaGermanyGhanaGibraltarGreeceGrenadaGuamGuatemalaGuineaGuinea-BissauGuyanaHaitiHeavily indebted poor countries (HIPC)High incomeHondurasHong Kong SAR, ChinaHungaryIBRD onlyIcelandIDA & IBRD totalIDA blendIDA onlyIDA totalIndiaIndonesiaIran, Islamic Rep.IraqIrelandIsraelItalyJamaicaJapanJordanKazakhstanKenyaKiribatiKorea, Dem. People’s Rep.Korea, Rep.KuwaitKyrgyz RepublicLao PDRLate-demographic dividendLatin America & Caribbean Latin America & Caribbean (excluding high income)Latin America & the Caribbean (IDA & IBRD countries)LatviaLeast developed countries: UN classificationLebanonLesothoLiberiaLibyaLiechtensteinLithuaniaLow & middle incomeLow incomeLower middle incomeLuxembourgMacao SAR, ChinaMacedonia, FYRMadagascarMalawiMalaysiaMaldivesMaliMaltaMarshall IslandsMauritaniaMauritiusMexicoMicronesia, Fed. Sts.Middle East & North AfricaMiddle East & North Africa (excluding high income)Middle East & North Africa (IDA & IBRD countries)Middle incomeMoldovaMonacoMongoliaMontenegroMoroccoMozambiqueMyanmarNamibiaNauruNepalNetherlandsNew CaledoniaNew ZealandNicaraguaNigerNigeriaNorth AmericaNorwayOECD membersOmanOther small statesPacific island small statesPakistanPalauPanamaPapua New GuineaParaguayPeruPhilippinesPolandPortugalPost-demographic dividendPre-demographic dividendPuerto RicoQatarRomaniaRussian FederationRwandaSamoaSan MarinoSao Tome and PrincipeSaudi ArabiaSenegalSerbiaSeychellesSierra LeoneSingaporeSint Maarten (Dutch part)Slovak RepublicSloveniaSmall statesSolomon IslandsSomaliaSouth AfricaSouth AsiaSouth Asia (IDA & IBRD)South SudanSpainSri LankaSt. Kitts and NevisSt. LuciaSt. Vincent and the GrenadinesSub-Saharan Africa Sub-Saharan Africa (excluding high income)Sub-Saharan Africa (IDA & IBRD countries)SudanSurinameSwazilandSwedenSwitzerlandSyrian Arab RepublicTajikistanTanzaniaThailandTimor-LesteTogoTongaTrinidad and TobagoTunisiaTurkeyTurkmenistanTurks and Caicos IslandsTuvaluUgandaUkraineUnited Arab EmiratesUnited KingdomUnited StatesUpper middle incomeUruguayUzbekistanVanuatuVenezuela, RBVietnamVirgin Islands (U.S.)West Bank and GazaWorldYemen, Rep.ZambiaZimbabwe Timeline:
This timeline shows a graph from 1971 to 2015 of Mauritius. No data until 1970. Number of actual observations by date: 45.
Source name:
World Development Indicators
Source organization:
UNESCO Institute for Statistics
Categories, topics:
Education
Last updated:
apr 23, 2017
Indicators value changes by year
Minimum:
105.447K
jan 1, 2015
Maximum:
155.624K
jan 1, 1973
At the date of observation
Value
Absolute change
Change from previous value
jan 1, 1971
150.402K
+150.402K
0.0%
jan 1, 1972
152.331K
+1.929K
1.28%
jan 1, 1973
155.624K
+3.293K
2.16%
jan 1, 1974
154.83K
-794.0
-0.51%
jan 1, 1975
152.417K
-2.413K
-1.56%
jan 1, 1976
150.573K
-1.844K
-1.21%
jan 1, 1977
144.325K
-6.248K
-4.15%
jan 1, 1978
140.905K
-3.42K
-2.37%
jan 1, 1979
138.318K
-2.587K
-1.84%
jan 1, 1980
130.185K
-8.133K
-5.88%
jan 1, 1981
128.758K
-1.427K
-1.1%
jan 1, 1982
135.462K
+6.704K
5.21%
jan 1, 1983
137.004K
+1.542K
1.14%
jan 1, 1984
138.79K
+1.786K
1.3%
jan 1, 1985
135.391K
-3.399K
-2.45%
jan 1, 1986
140.714K
+5.323K
3.93%
jan 1, 1987
144.697K
+3.983K
2.83%
jan 1, 1988
144.13K
-567.0
-0.39%
jan 1, 1989
140.135K
-3.995K
-2.77%
jan 1, 1990
137.929K
-2.206K
-1.57%
jan 1, 1991
137.491K
-438.0
-0.32%
jan 1, 1992
135.233K
-2.258K
-1.64%
jan 1, 1993
129.738K
-5.495K
-4.06%
jan 1, 1994
125.543K
-4.195K
-3.23%
jan 1, 1995
123.167K
-2.376K
-1.89%
jan 1, 1996
122.895K
-272.0
-0.22%
jan 1, 1997
124.589K
+1.694K
1.38%
jan 1, 1998
127.109K
+2.52K
2.02%
jan 1, 1999
130.505K
+3.396K
2.67%
jan 1, 2000
133.489K
+2.984K
2.29%
jan 1, 2001
135.237K
+1.748K
1.31%
jan 1, 2002
134.085K
-1.152K
-0.85%
jan 1, 2003
132.432K
-1.653K
-1.23%
jan 1, 2004
129.616K
-2.816K
-2.13%
jan 1, 2005
126.226K
-3.39K
-2.62%
jan 1, 2006
123.562K
-2.664K
-2.11%
jan 1, 2007
121.387K
-2.175K
-1.76%
jan 1, 2008
119.31K
-2.077K
-1.71%
jan 1, 2009
119.022K
-288.0
-0.24%
jan 1, 2010
117.922K
-1.1K
-0.92%
jan 1, 2011
117.432K
-490.0
-0.42%
jan 1, 2012
116.068K
-1.364K
-1.16%
jan 1, 2013
113.634K
-2.434K
-2.1%
jan 1, 2014
109.097K
-4.537K
-3.99%
jan 1, 2015
105.447K
-3.65K
-3.35%
Ranking of countries by current statistics by years


Comments: