29
/
en
AIzaSyAYiBZKx7MnpbEhh9jyipgxe19OcubqV5w
April 1, 2024
273492
Ukraine
UKR
true
2
1
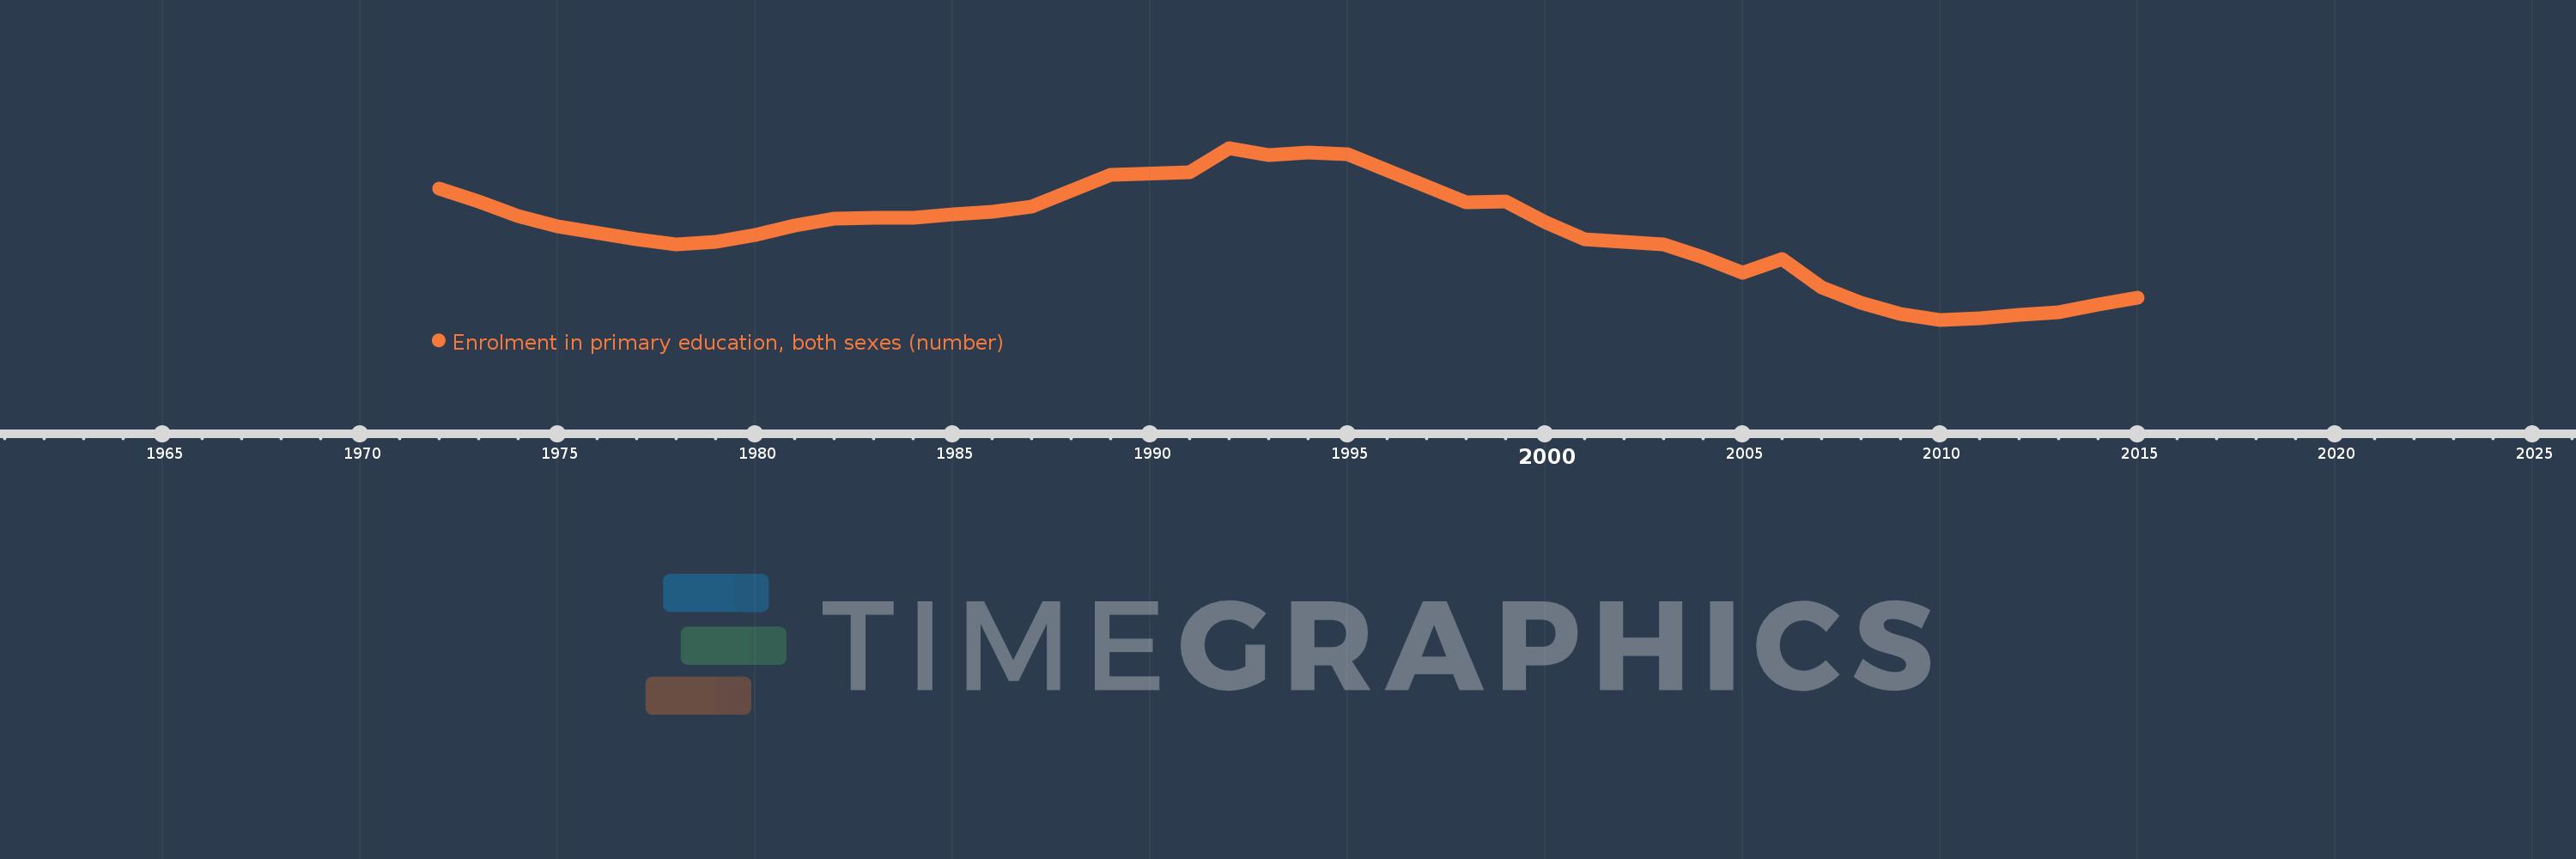
Enrolment in primary education, both sexes (number)
2015,2014,2013,2012,2011,2010,2009,2008,2007,2006,2005,2004,2003,2002,2001,2000,1999,1998,1995,1994,1993,1992,1991,1989,1987,1986,1985,1984,1983,1982,1981,1980,1979,1978,1977,1975,1974,1973,1972
This statistics in other country:
AfghanistanAlbaniaAlgeriaAmerican SamoaAndorraAngolaAntigua and BarbudaArab WorldArgentinaArmeniaArubaAustraliaAustriaAzerbaijanBahamas, TheBahrainBangladeshBarbadosBelarusBelgiumBelizeBeninBermudaBhutanBoliviaBosnia and HerzegovinaBotswanaBrazilBritish Virgin IslandsBrunei DarussalamBulgariaBurkina FasoBurundiCabo VerdeCambodiaCameroonCanadaCaribbean small statesCayman IslandsCentral African RepublicCentral Europe and the BalticsChadChileChinaColombiaComorosCongo, Dem. Rep.Congo, Rep.Costa RicaCote d'IvoireCroatiaCubaCuracaoCyprusCzech RepublicDenmarkDjiboutiDominicaDominican RepublicEarly-demographic dividendEast Asia & PacificEast Asia & Pacific (excluding high income)East Asia & Pacific (IDA & IBRD countries)EcuadorEgypt, Arab Rep.El SalvadorEquatorial GuineaEritreaEstoniaEthiopiaEuro areaEurope & Central AsiaEurope & Central Asia (excluding high income)Europe & Central Asia (IDA & IBRD countries)European UnionFaroe IslandsFijiFinlandFragile and conflict affected situationsFranceFrench PolynesiaGabonGambia, TheGeorgiaGermanyGhanaGibraltarGreeceGrenadaGuamGuatemalaGuineaGuinea-BissauGuyanaHaitiHeavily indebted poor countries (HIPC)High incomeHondurasHong Kong SAR, ChinaHungaryIBRD onlyIcelandIDA & IBRD totalIDA blendIDA onlyIDA totalIndiaIndonesiaIran, Islamic Rep.IraqIrelandIsraelItalyJamaicaJapanJordanKazakhstanKenyaKiribatiKorea, Dem. People’s Rep.Korea, Rep.KuwaitKyrgyz RepublicLao PDRLate-demographic dividendLatin America & Caribbean Latin America & Caribbean (excluding high income)Latin America & the Caribbean (IDA & IBRD countries)LatviaLeast developed countries: UN classificationLebanonLesothoLiberiaLibyaLiechtensteinLithuaniaLow & middle incomeLow incomeLower middle incomeLuxembourgMacao SAR, ChinaMacedonia, FYRMadagascarMalawiMalaysiaMaldivesMaliMaltaMarshall IslandsMauritaniaMauritiusMexicoMicronesia, Fed. Sts.Middle East & North AfricaMiddle East & North Africa (excluding high income)Middle East & North Africa (IDA & IBRD countries)Middle incomeMoldovaMonacoMongoliaMontenegroMoroccoMozambiqueMyanmarNamibiaNauruNepalNetherlandsNew CaledoniaNew ZealandNicaraguaNigerNigeriaNorth AmericaNorwayOECD membersOmanOther small statesPacific island small statesPakistanPalauPanamaPapua New GuineaParaguayPeruPhilippinesPolandPortugalPost-demographic dividendPre-demographic dividendPuerto RicoQatarRomaniaRussian FederationRwandaSamoaSan MarinoSao Tome and PrincipeSaudi ArabiaSenegalSerbiaSeychellesSierra LeoneSingaporeSint Maarten (Dutch part)Slovak RepublicSloveniaSmall statesSolomon IslandsSomaliaSouth AfricaSouth AsiaSouth Asia (IDA & IBRD)South SudanSpainSri LankaSt. Kitts and NevisSt. LuciaSt. Vincent and the GrenadinesSub-Saharan Africa Sub-Saharan Africa (excluding high income)Sub-Saharan Africa (IDA & IBRD countries)SudanSurinameSwazilandSwedenSwitzerlandSyrian Arab RepublicTajikistanTanzaniaThailandTimor-LesteTogoTongaTrinidad and TobagoTunisiaTurkeyTurkmenistanTurks and Caicos IslandsTuvaluUgandaUkraineUnited Arab EmiratesUnited KingdomUnited StatesUpper middle incomeUruguayUzbekistanVanuatuVenezuela, RBVietnamVirgin Islands (U.S.)West Bank and GazaWorldYemen, Rep.ZambiaZimbabwe Timeline:
This timeline shows a graph from 1972 to 2015 of Ukraine. No data until 1971. Number of actual observations by date: 39.
Source name:
World Development Indicators
Source organization:
UNESCO Institute for Statistics
Categories, topics:
Education
Last updated:
apr 23, 2017
Indicators value changes by year
Minimum:
1.532 mln
jan 1, 2010
Maximum:
2.704 mln
jan 1, 1992
At the date of observation
Value
Absolute change
Change from previous value
jan 1, 1972
2.425 mln
+2.425 mln
0.0%
jan 1, 1973
2.339 mln
-86.7K
-3.57%
jan 1, 1974
2.24 mln
-98.7K
-4.22%
jan 1, 1975
2.167 mln
-72.5K
-3.24%
jan 1, 1977
2.082 mln
-85.1K
-3.93%
jan 1, 1978
2.048 mln
-34.0K
-1.63%
jan 1, 1979
2.063 mln
+14.3K
0.7%
jan 1, 1980
2.108 mln
+45.2K
2.19%
jan 1, 1981
2.177 mln
+69.6K
3.3%
jan 1, 1982
2.219 mln
+41.476K
1.9%
jan 1, 1983
2.229 mln
+10.624K
0.48%
jan 1, 1984
2.23 mln
+300.0
0.01%
jan 1, 1985
2.254 mln
+23.8K
1.07%
jan 1, 1986
2.269 mln
+15.5K
0.69%
jan 1, 1987
2.302 mln
+32.8K
1.45%
jan 1, 1989
2.519 mln
+216.8K
9.42%
jan 1, 1991
2.539 mln
+20.8K
0.83%
jan 1, 1992
2.704 mln
+164.294K
6.47%
jan 1, 1993
2.657 mln
-47.233K
-1.75%
jan 1, 1994
2.674 mln
+17.758K
0.67%
jan 1, 1995
2.661 mln
-13.624K
-0.51%
jan 1, 1998
2.332 mln
-329.081K
-12.37%
jan 1, 1999
2.339 mln
+7.504K
0.32%
jan 1, 2000
2.2 mln
-139.02K
-5.94%
jan 1, 2001
2.079 mln
-121.399K
-5.52%
jan 1, 2002
2.065 mln
-13.351K
-0.64%
jan 1, 2003
2.047 mln
-18.263K
-0.88%
jan 1, 2004
1.961 mln
-86.573K
-4.23%
jan 1, 2005
1.851 mln
-109.778K
-5.6%
jan 1, 2006
1.946 mln
+94.981K
5.13%
jan 1, 2007
1.754 mln
-192.026K
-9.87%
jan 1, 2008
1.648 mln
-105.842K
-6.04%
jan 1, 2009
1.573 mln
-74.389K
-4.51%
jan 1, 2010
1.532 mln
-41.515K
-2.64%
jan 1, 2011
1.54 mln
+8.339K
0.54%
jan 1, 2012
1.563 mln
+23.114K
1.5%
jan 1, 2013
1.584 mln
+20.986K
1.34%
jan 1, 2014
1.638 mln
+54.115K
3.42%
jan 1, 2015
1.685 mln
+46.533K
2.84%
Ranking of countries by current statistics by years


Comments: