29
/
en
AIzaSyAYiBZKx7MnpbEhh9jyipgxe19OcubqV5w
April 1, 2024
79280
Barbados
BRB
true
2
1
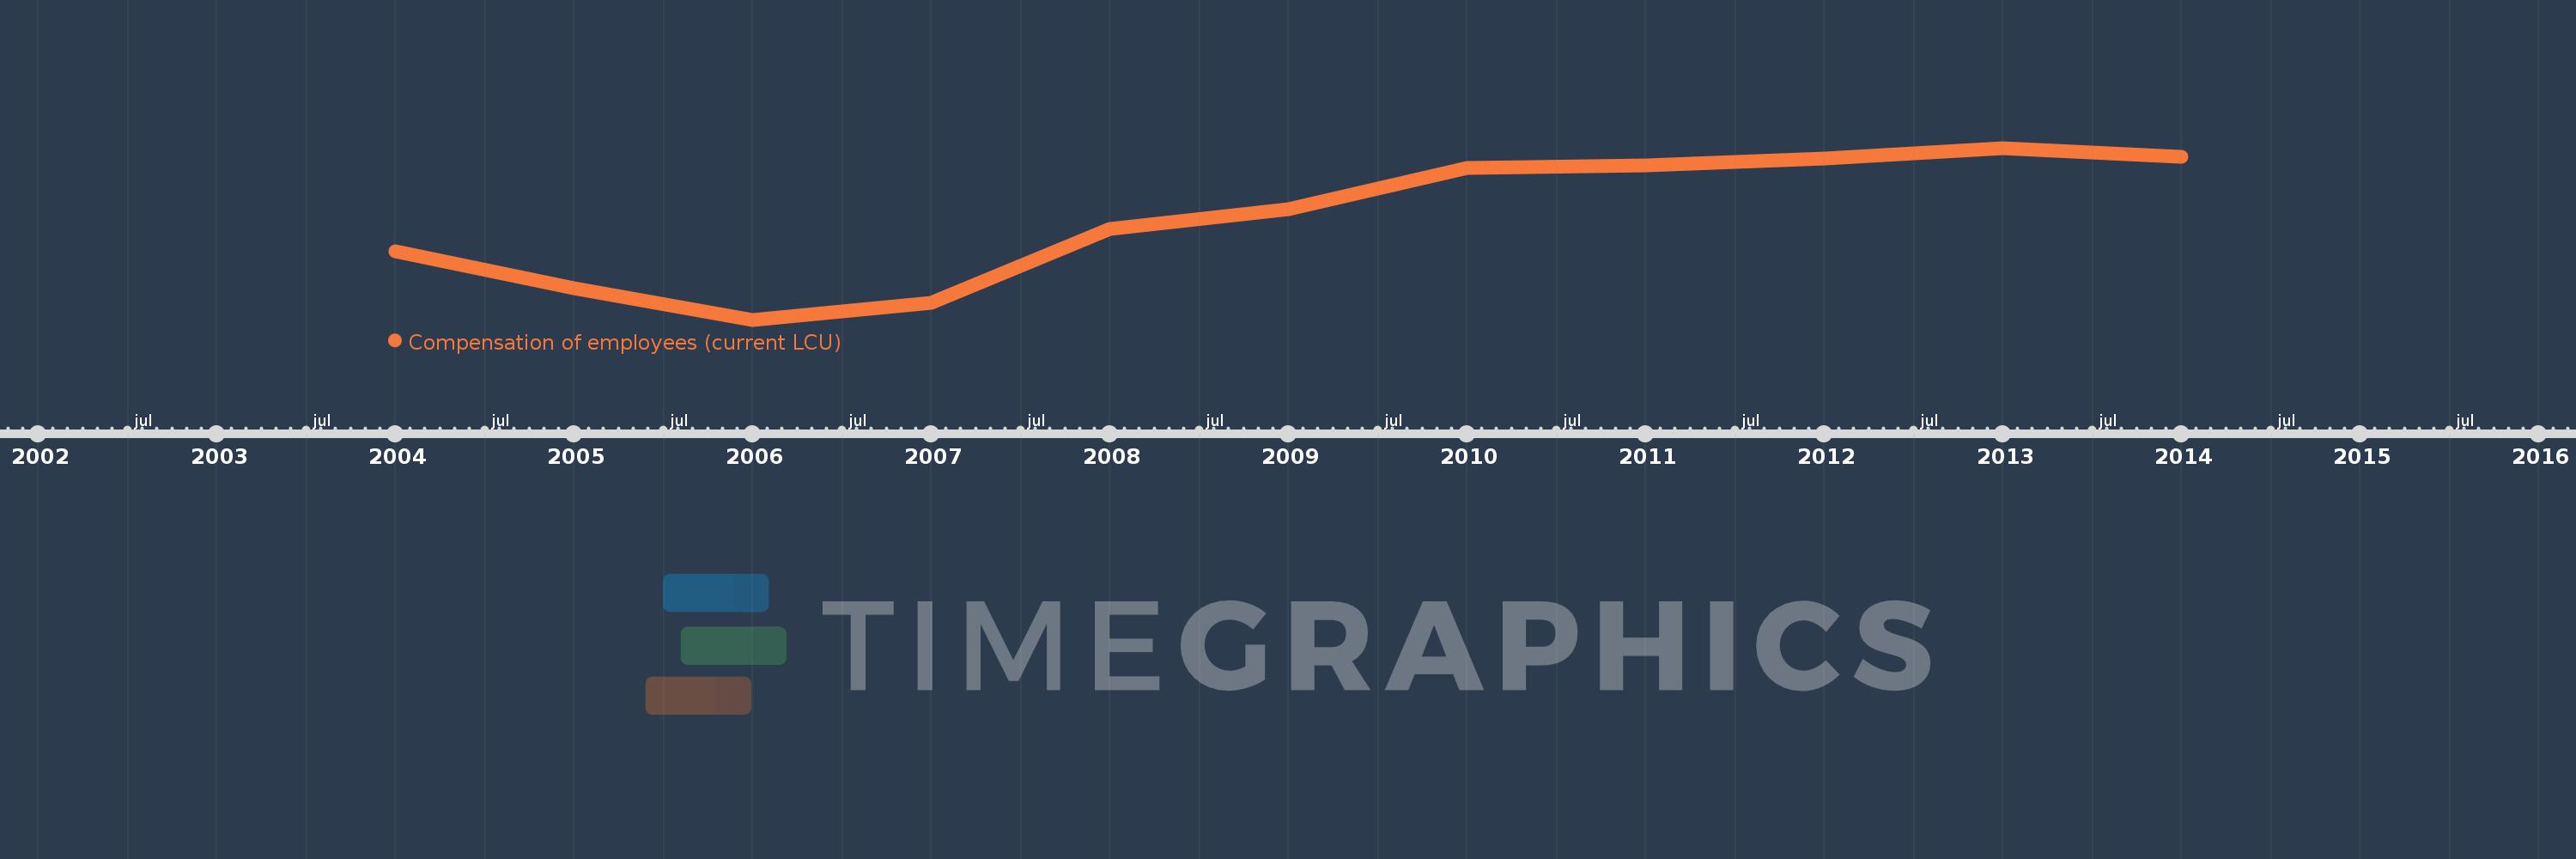
Compensation of employees (current LCU)
2014,2013,2012,2011,2010,2009,2008,2007,2006,2005,2004
This statistics in other country:
AfghanistanAlbaniaAlgeriaAngolaAntigua and BarbudaArmeniaAustraliaAustriaAzerbaijanBahamas, TheBahrainBangladeshBarbadosBelarusBelgiumBelizeBeninBhutanBoliviaBosnia and HerzegovinaBotswanaBrazilBulgariaBurkina FasoBurundiCabo VerdeCambodiaCanadaCentral African RepublicChileColombiaCongo, Dem. Rep.Congo, Rep.Costa RicaCote d'IvoireCroatiaCyprusCzech RepublicDenmarkDominicaDominican RepublicEgypt, Arab Rep.El SalvadorEquatorial GuineaEstoniaEthiopiaFijiFinlandFranceGambia, TheGeorgiaGermanyGhanaGreeceGrenadaGuatemalaHondurasHong Kong SAR, ChinaHungaryIcelandIndiaIndonesiaIran, Islamic Rep.IraqIrelandIsraelItalyJamaicaJapanJordanKazakhstanKenyaKiribatiKorea, Rep.KuwaitKyrgyz RepublicLao PDRLatviaLebanonLesothoLiberiaLithuaniaLuxembourgMacao SAR, ChinaMacedonia, FYRMadagascarMalawiMalaysiaMaldivesMaliMaltaMauritiusMexicoMicronesia, Fed. Sts.MoldovaMongoliaMoroccoMozambiqueNamibiaNepalNetherlandsNew ZealandNicaraguaNigeriaNorwayOmanPakistanPanamaPapua New GuineaParaguayPeruPhilippinesPolandPortugalQatarRomaniaRussian FederationRwandaSamoaSan MarinoSao Tome and PrincipeSenegalSerbiaSeychellesSierra LeoneSingaporeSlovak RepublicSloveniaSolomon IslandsSouth AfricaSpainSri LankaSt. Kitts and NevisSt. LuciaSurinameSwazilandSwedenSwitzerlandSyrian Arab RepublicTajikistanTanzaniaThailandTimor-LesteTogoTrinidad and TobagoTunisiaTurkeyUgandaUkraineUnited Arab EmiratesUnited KingdomUnited StatesUruguayVanuatuVenezuela, RBWest Bank and GazaYemen, Rep.ZambiaZimbabwe Timeline:
This timeline shows a graph from 2004 to 2014 of Barbados. No data until 2003. Number of actual observations by date: 11.
Source name:
World Development Indicators
Source organization:
International Monetary Fund, Government Finance Statistics Yearbook and data files.
Categories, topics:
Public Sector
Last updated:
apr 23, 2017
Indicators value changes by year
Minimum:
701.29 mln
jan 1, 2006
Maximum:
906.113 mln
jan 1, 2013
At the date of observation
Value
Absolute change
Change from previous value
jan 1, 2004
782.96 mln
+782.96 mln
0.0%
jan 1, 2005
738.4 mln
-44.56 mln
-5.69%
jan 1, 2006
701.29 mln
-37.11 mln
-5.03%
jan 1, 2007
721.779 mln
+20.489 mln
2.92%
jan 1, 2008
809.148 mln
+87.369 mln
12.1%
jan 1, 2009
832.695 mln
+23.547 mln
2.91%
jan 1, 2010
882.255 mln
+49.56 mln
5.95%
jan 1, 2011
885.102 mln
+2.847 mln
0.32%
jan 1, 2012
893.349 mln
+8.247 mln
0.93%
jan 1, 2013
906.113 mln
+12.764 mln
1.43%
jan 1, 2014
895.584 mln
-10.529 mln
-1.16%
Ranking of countries by current statistics by years


Comments: