29
/
en
AIzaSyAYiBZKx7MnpbEhh9jyipgxe19OcubqV5w
April 1, 2024
286966
Zimbabwe
ZWE
true
2
1
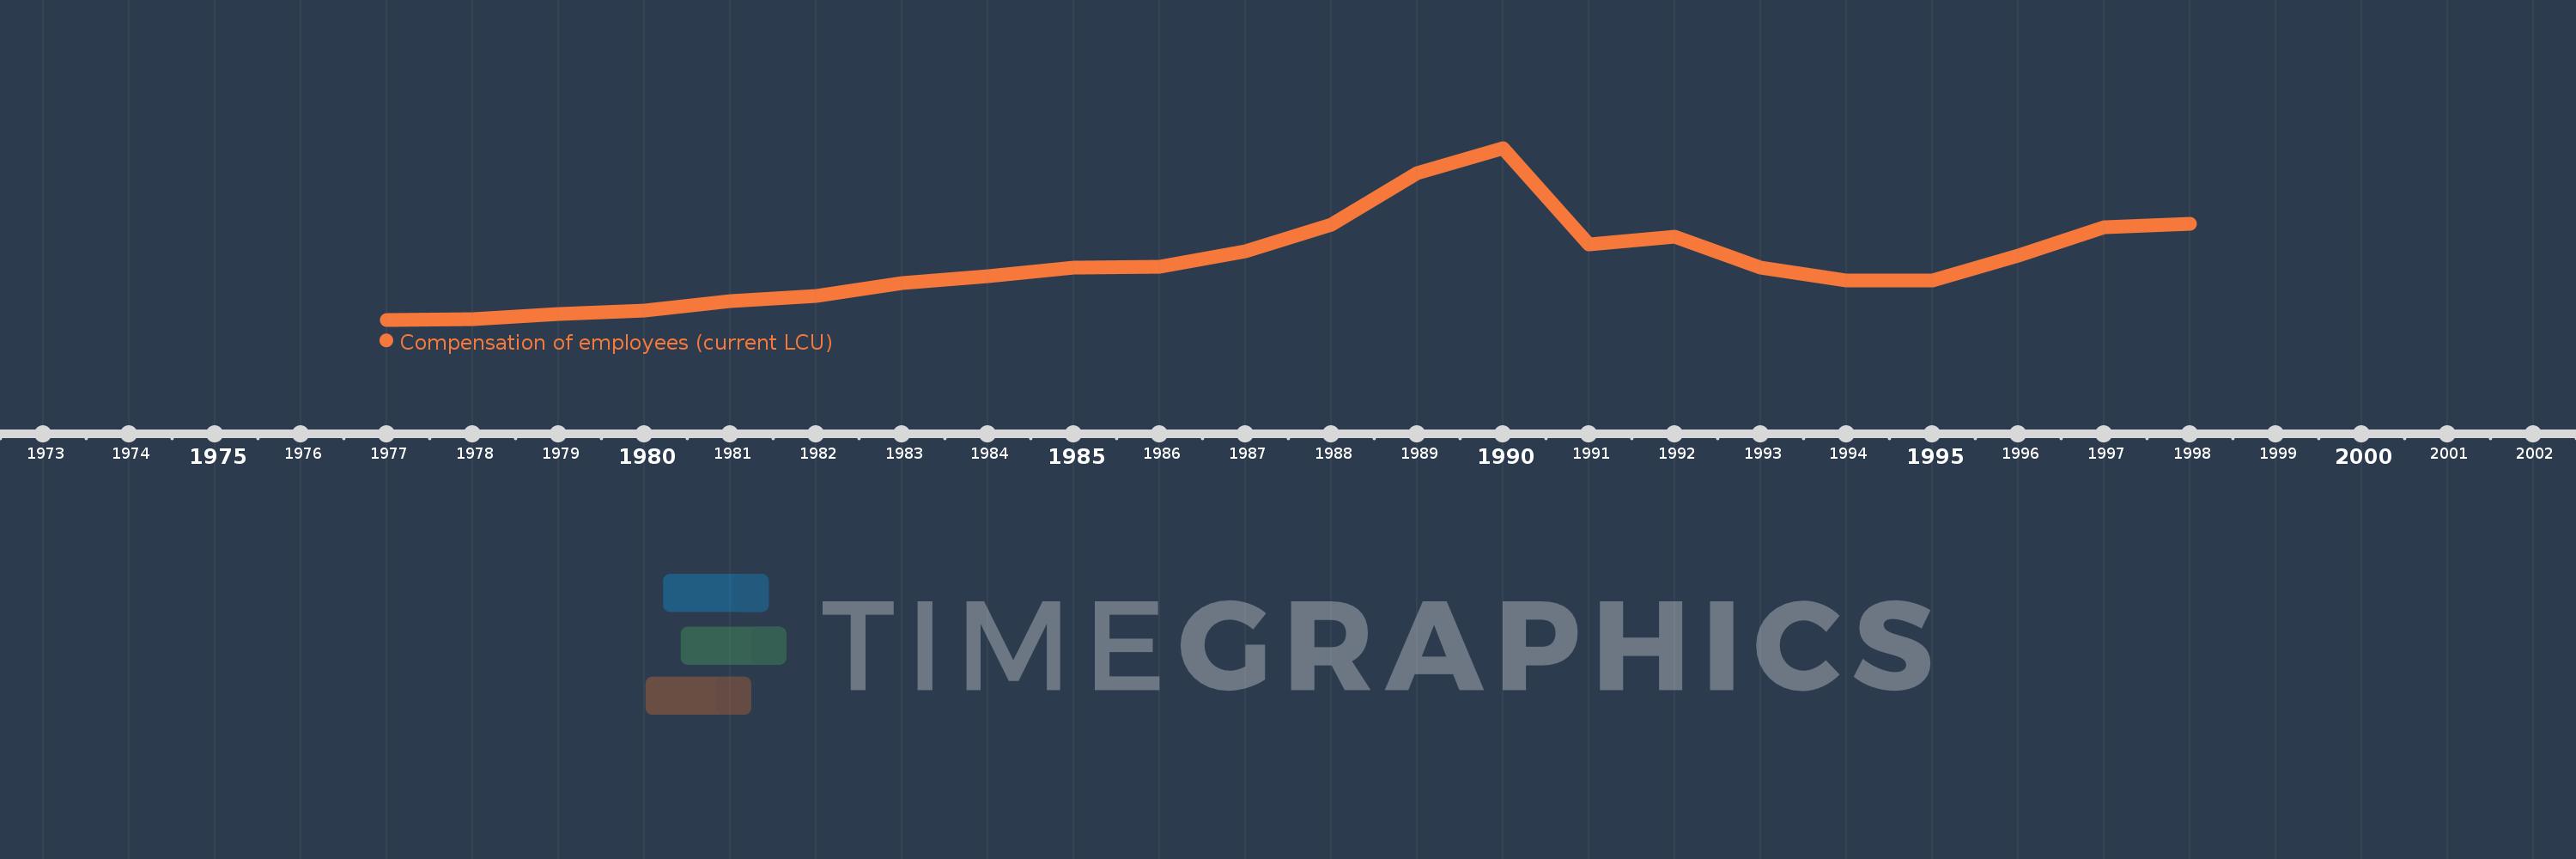
Compensation of employees (current LCU)
1998,1997,1996,1995,1994,1993,1992,1991,1990,1989,1988,1987,1986,1985,1984,1983,1982,1981,1980,1979,1978,1977
This statistics in other country:
AfghanistanAlbaniaAlgeriaAngolaAntigua and BarbudaArmeniaAustraliaAustriaAzerbaijanBahamas, TheBahrainBangladeshBarbadosBelarusBelgiumBelizeBeninBhutanBoliviaBosnia and HerzegovinaBotswanaBrazilBulgariaBurkina FasoBurundiCabo VerdeCambodiaCanadaCentral African RepublicChileColombiaCongo, Dem. Rep.Congo, Rep.Costa RicaCote d'IvoireCroatiaCyprusCzech RepublicDenmarkDominicaDominican RepublicEgypt, Arab Rep.El SalvadorEquatorial GuineaEstoniaEthiopiaFijiFinlandFranceGambia, TheGeorgiaGermanyGhanaGreeceGrenadaGuatemalaHondurasHong Kong SAR, ChinaHungaryIcelandIndiaIndonesiaIran, Islamic Rep.IraqIrelandIsraelItalyJamaicaJapanJordanKazakhstanKenyaKiribatiKorea, Rep.KuwaitKyrgyz RepublicLao PDRLatviaLebanonLesothoLiberiaLithuaniaLuxembourgMacao SAR, ChinaMacedonia, FYRMadagascarMalawiMalaysiaMaldivesMaliMaltaMauritiusMexicoMicronesia, Fed. Sts.MoldovaMongoliaMoroccoMozambiqueNamibiaNepalNetherlandsNew ZealandNicaraguaNigeriaNorwayOmanPakistanPanamaPapua New GuineaParaguayPeruPhilippinesPolandPortugalQatarRomaniaRussian FederationRwandaSamoaSan MarinoSao Tome and PrincipeSenegalSerbiaSeychellesSierra LeoneSingaporeSlovak RepublicSloveniaSolomon IslandsSouth AfricaSpainSri LankaSt. Kitts and NevisSt. LuciaSurinameSwazilandSwedenSwitzerlandSyrian Arab RepublicTajikistanTanzaniaThailandTimor-LesteTogoTrinidad and TobagoTunisiaTurkeyUgandaUkraineUnited Arab EmiratesUnited KingdomUnited StatesUruguayVanuatuVenezuela, RBWest Bank and GazaYemen, Rep.ZambiaZimbabwe Timeline:
This timeline shows a graph from 1977 to 1998 of Zimbabwe. No data until 1976. Number of actual observations by date: 22.
Source name:
World Development Indicators
Source organization:
International Monetary Fund, Government Finance Statistics Yearbook and data files.
Categories, topics:
Public Sector
Last updated:
apr 23, 2017
Indicators value changes by year
Minimum:
203.1 mln
jan 1, 1977
Maximum:
1.75 bln
jan 1, 1990
At the date of observation
Value
Absolute change
Change from previous value
jan 1, 1977
203.1 mln
+203.1 mln
0.0%
jan 1, 1978
207.2 mln
+4.1 mln
2.02%
jan 1, 1979
255.3 mln
+48.1 mln
23.21%
jan 1, 1980
285.2 mln
+29.9 mln
11.71%
jan 1, 1981
370.4 mln
+85.2 mln
29.87%
jan 1, 1982
417.4 mln
+47.0 mln
12.69%
jan 1, 1983
533.8 mln
+116.4 mln
27.89%
jan 1, 1984
596.8 mln
+63.0 mln
11.8%
jan 1, 1985
672.2 mln
+75.4 mln
12.63%
jan 1, 1986
682.9 mln
+10.7 mln
1.59%
jan 1, 1987
820.4 mln
+137.5 mln
20.13%
jan 1, 1988
1.059 bln
+238.2 mln
29.03%
jan 1, 1989
1.524 bln
+465.0 mln
43.93%
jan 1, 1990
1.75 bln
+226.4 mln
14.86%
jan 1, 1991
881.528 mln
-868.472 mln
-49.63%
jan 1, 1992
951.954 mln
+70.426 mln
7.99%
jan 1, 1993
674.951 mln
-277.004 mln
-29.1%
jan 1, 1994
553.925 mln
-121.026 mln
-17.93%
jan 1, 1995
555.117 mln
+1.192 mln
0.22%
jan 1, 1996
777.887 mln
+222.77 mln
40.13%
jan 1, 1997
1.035 bln
+257.265 mln
33.07%
jan 1, 1998
1.069 bln
+34.319 mln
3.32%
Ranking of countries by current statistics by years


Comments: