29
/
en
AIzaSyAYiBZKx7MnpbEhh9jyipgxe19OcubqV5w
April 1, 2024
215098
Oman
OMN
true
2
1
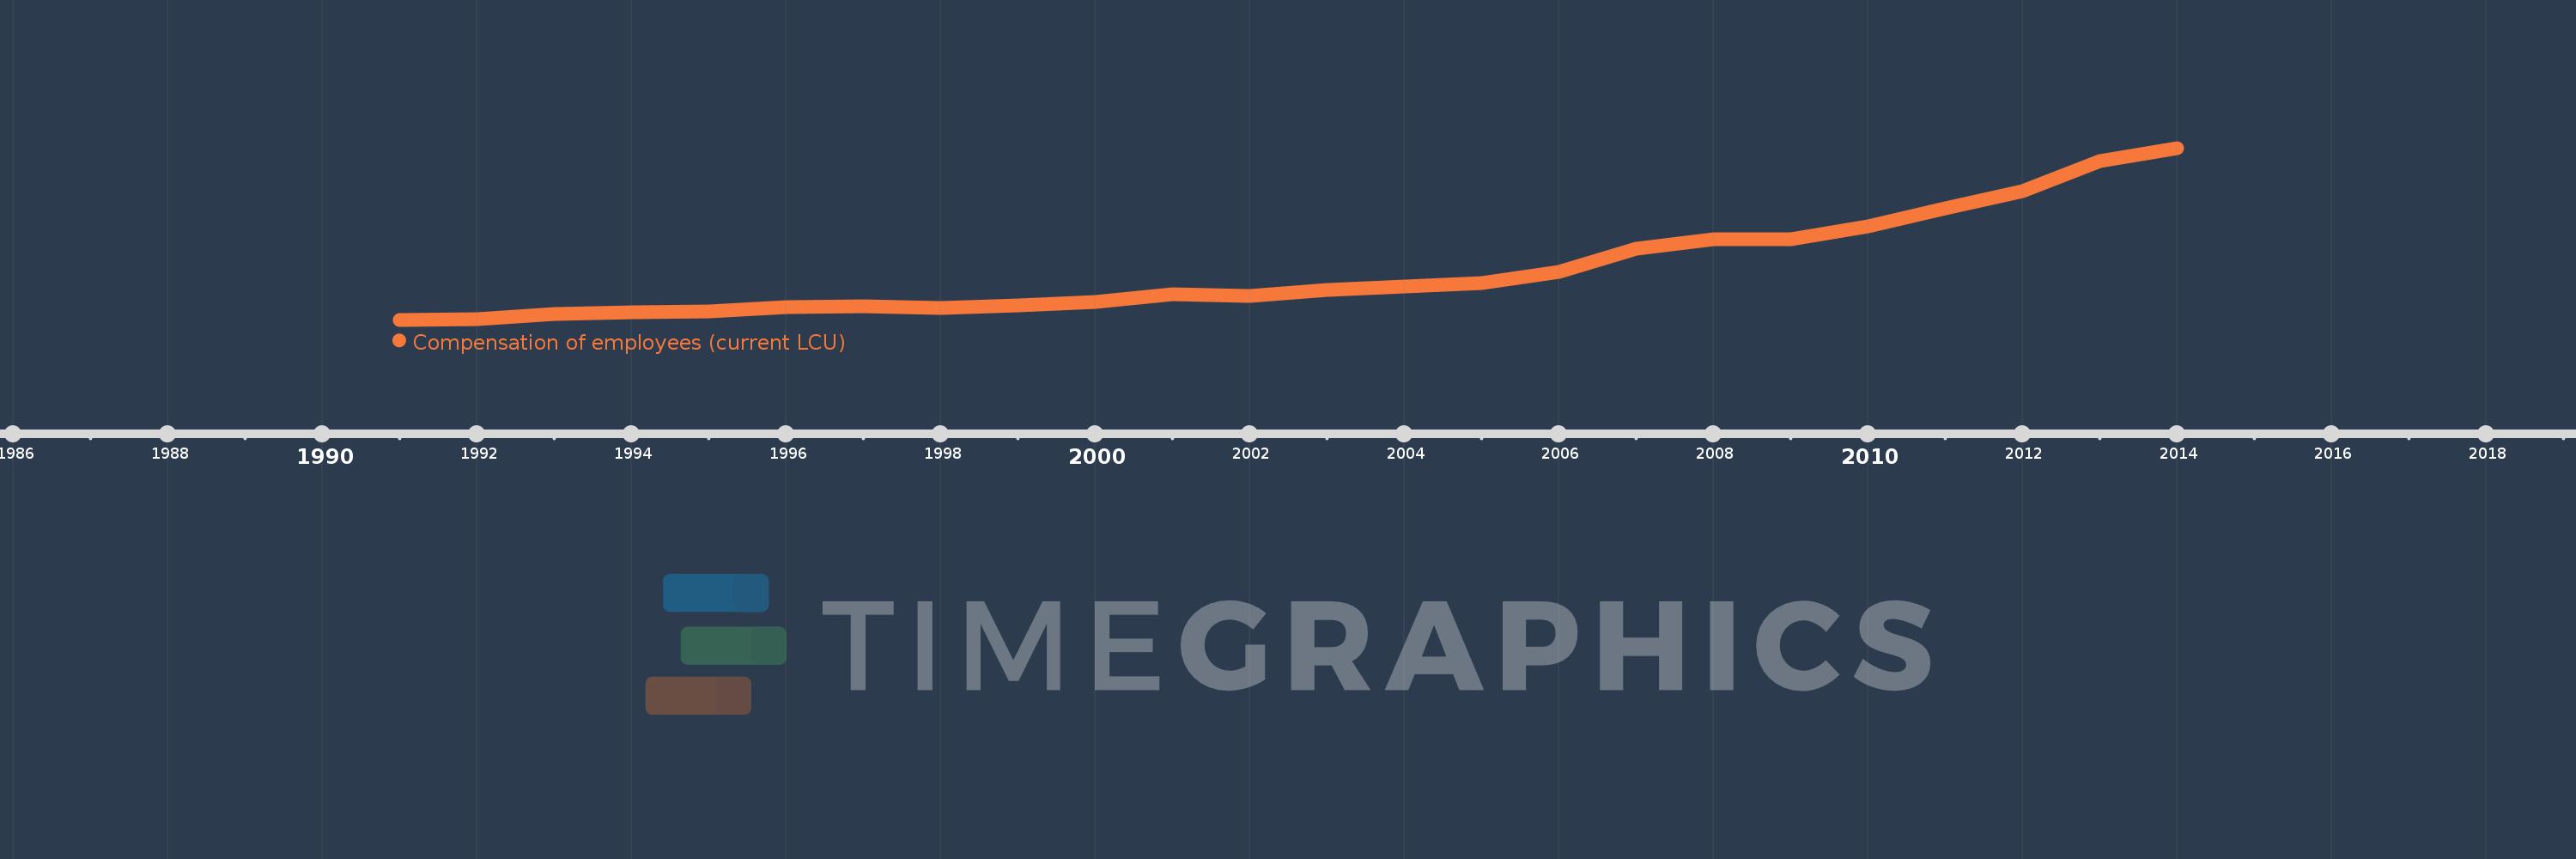
Compensation of employees (current LCU)
2014,2013,2012,2011,2010,2009,2008,2007,2006,2005,2004,2003,2002,2001,2000,1999,1998,1997,1996,1995,1994,1993,1992,1991
This statistics in other country:
AfghanistanAlbaniaAlgeriaAngolaAntigua and BarbudaArmeniaAustraliaAustriaAzerbaijanBahamas, TheBahrainBangladeshBarbadosBelarusBelgiumBelizeBeninBhutanBoliviaBosnia and HerzegovinaBotswanaBrazilBulgariaBurkina FasoBurundiCabo VerdeCambodiaCanadaCentral African RepublicChileColombiaCongo, Dem. Rep.Congo, Rep.Costa RicaCote d'IvoireCroatiaCyprusCzech RepublicDenmarkDominicaDominican RepublicEgypt, Arab Rep.El SalvadorEquatorial GuineaEstoniaEthiopiaFijiFinlandFranceGambia, TheGeorgiaGermanyGhanaGreeceGrenadaGuatemalaHondurasHong Kong SAR, ChinaHungaryIcelandIndiaIndonesiaIran, Islamic Rep.IraqIrelandIsraelItalyJamaicaJapanJordanKazakhstanKenyaKiribatiKorea, Rep.KuwaitKyrgyz RepublicLao PDRLatviaLebanonLesothoLiberiaLithuaniaLuxembourgMacao SAR, ChinaMacedonia, FYRMadagascarMalawiMalaysiaMaldivesMaliMaltaMauritiusMexicoMicronesia, Fed. Sts.MoldovaMongoliaMoroccoMozambiqueNamibiaNepalNetherlandsNew ZealandNicaraguaNigeriaNorwayOmanPakistanPanamaPapua New GuineaParaguayPeruPhilippinesPolandPortugalQatarRomaniaRussian FederationRwandaSamoaSan MarinoSao Tome and PrincipeSenegalSerbiaSeychellesSierra LeoneSingaporeSlovak RepublicSloveniaSolomon IslandsSouth AfricaSpainSri LankaSt. Kitts and NevisSt. LuciaSurinameSwazilandSwedenSwitzerlandSyrian Arab RepublicTajikistanTanzaniaThailandTimor-LesteTogoTrinidad and TobagoTunisiaTurkeyUgandaUkraineUnited Arab EmiratesUnited KingdomUnited StatesUruguayVanuatuVenezuela, RBWest Bank and GazaYemen, Rep.ZambiaZimbabwe Timeline:
This timeline shows a graph from 1991 to 2014 of Oman. No data until 1990. Number of actual observations by date: 24.
Source name:
World Development Indicators
Source organization:
International Monetary Fund, Government Finance Statistics Yearbook and data files.
Categories, topics:
Public Sector
Last updated:
apr 23, 2017
Indicators value changes by year
Minimum:
352.3 mln
jan 1, 1991
Maximum:
2.472 bln
jan 1, 2014
At the date of observation
Value
Absolute change
Change from previous value
jan 1, 1991
352.3 mln
+352.3 mln
0.0%
jan 1, 1992
356.0 mln
+3.7 mln
1.05%
jan 1, 1993
418.4 mln
+62.4 mln
17.53%
jan 1, 1994
441.5 mln
+23.1 mln
5.52%
jan 1, 1995
459.2 mln
+17.7 mln
4.01%
jan 1, 1996
511.9 mln
+52.7 mln
11.48%
jan 1, 1997
521.8 mln
+9.9 mln
1.93%
jan 1, 1998
501.8 mln
-20.0 mln
-3.83%
jan 1, 1999
527.8 mln
+26.0 mln
5.18%
jan 1, 2000
569.6 mln
+41.8 mln
7.92%
jan 1, 2001
670.9 mln
+101.3 mln
17.78%
jan 1, 2002
650.8 mln
-20.1 mln
-3.0%
jan 1, 2003
716.4 mln
+65.6 mln
10.08%
jan 1, 2004
758.9 mln
+42.5 mln
5.93%
jan 1, 2005
805.6 mln
+46.7 mln
6.15%
jan 1, 2006
938.1 mln
+132.5 mln
16.45%
jan 1, 2007
1.228 bln
+289.4 mln
30.85%
jan 1, 2008
1.348 bln
+120.4 mln
9.81%
jan 1, 2009
1.348 bln
0.0
0.0%
jan 1, 2010
1.506 bln
+158.6 mln
11.77%
jan 1, 2011
1.723 bln
+216.2 mln
14.35%
jan 1, 2012
1.935 bln
+212.7 mln
12.35%
jan 1, 2013
2.308 bln
+372.2 mln
19.23%
jan 1, 2014
2.472 bln
+164.5 mln
7.13%
Ranking of countries by current statistics by years


Comments: