29
/
en
AIzaSyAYiBZKx7MnpbEhh9jyipgxe19OcubqV5w
April 1, 2024
167245
Kenya
KEN
true
2
1
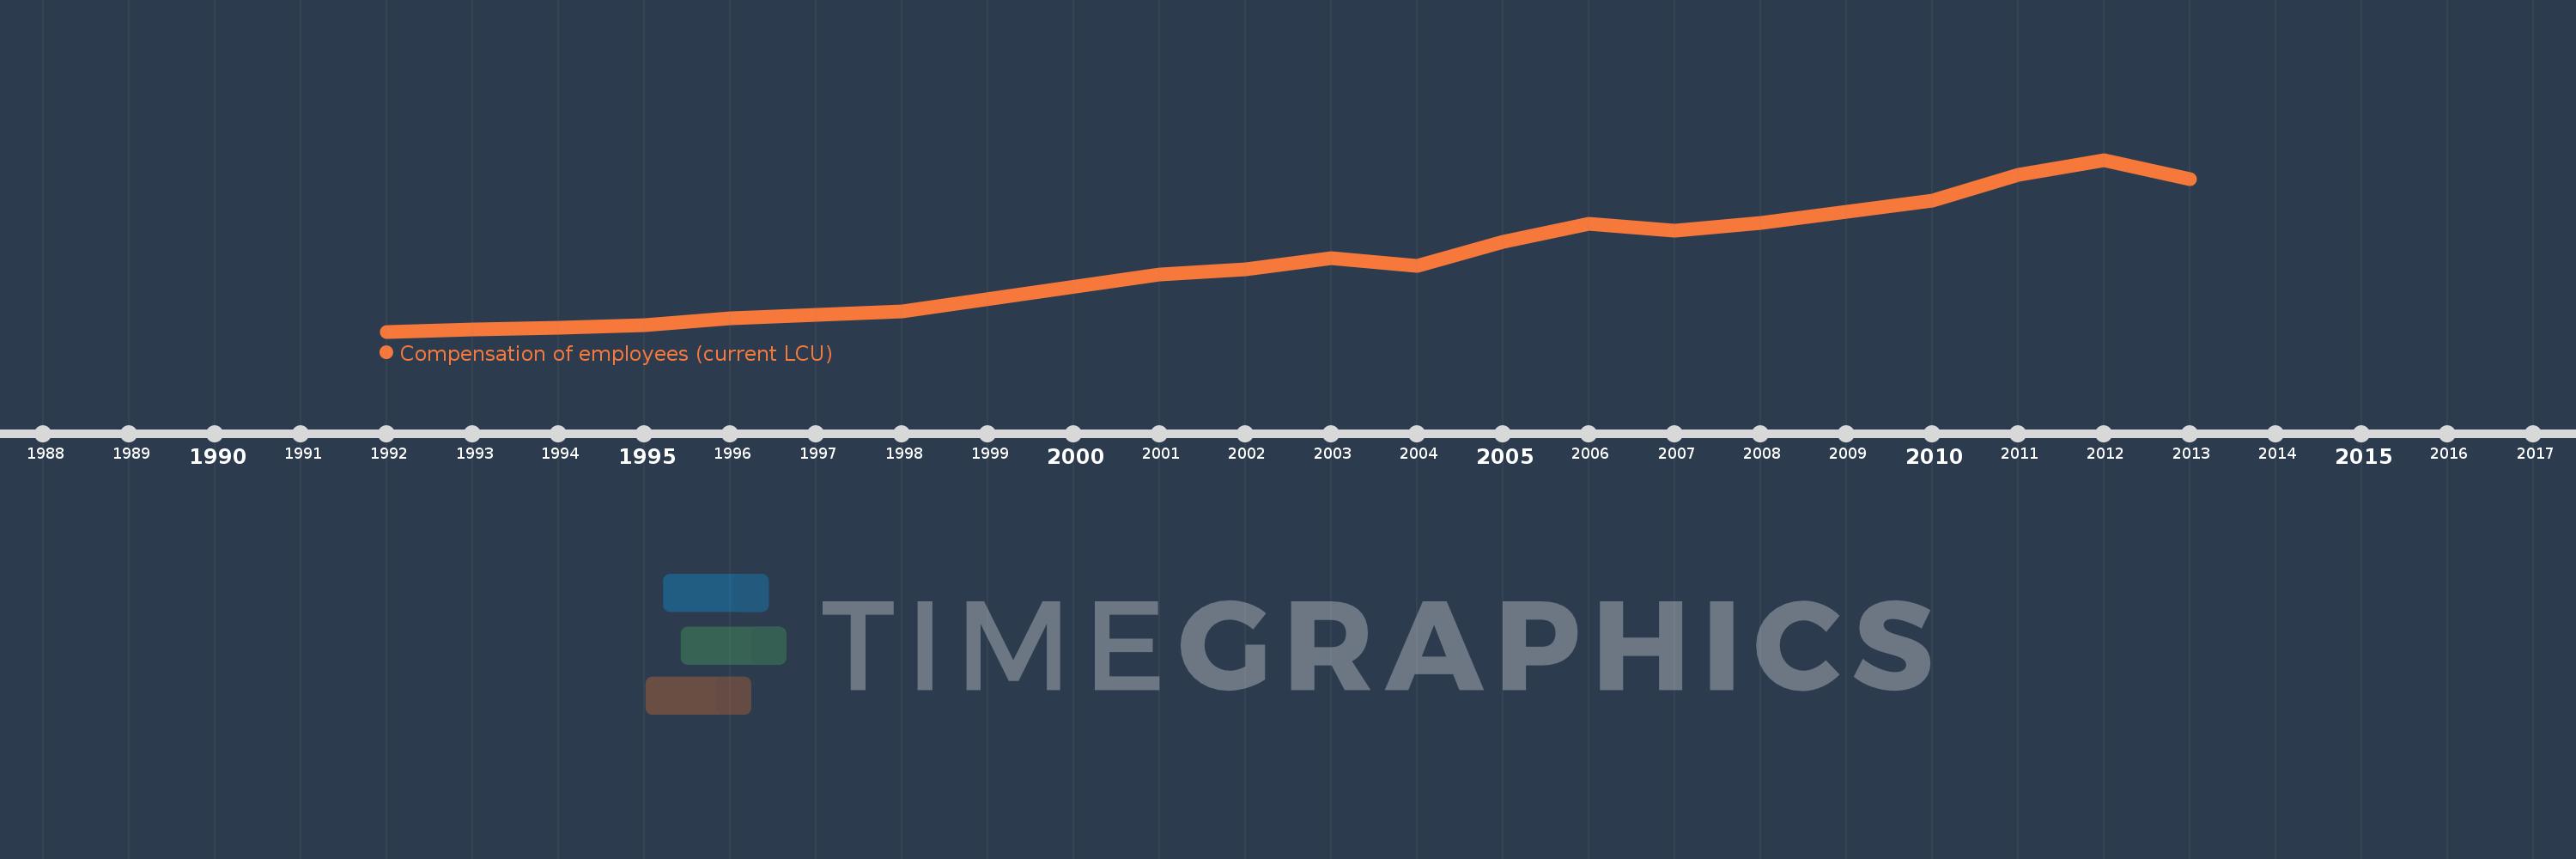
Compensation of employees (current LCU)
2013,2012,2011,2010,2009,2008,2007,2006,2005,2004,2003,2002,2001,1998,1997,1996,1995,1994,1993,1992
This statistics in other country:
AfghanistanAlbaniaAlgeriaAngolaAntigua and BarbudaArmeniaAustraliaAustriaAzerbaijanBahamas, TheBahrainBangladeshBarbadosBelarusBelgiumBelizeBeninBhutanBoliviaBosnia and HerzegovinaBotswanaBrazilBulgariaBurkina FasoBurundiCabo VerdeCambodiaCanadaCentral African RepublicChileColombiaCongo, Dem. Rep.Congo, Rep.Costa RicaCote d'IvoireCroatiaCyprusCzech RepublicDenmarkDominicaDominican RepublicEgypt, Arab Rep.El SalvadorEquatorial GuineaEstoniaEthiopiaFijiFinlandFranceGambia, TheGeorgiaGermanyGhanaGreeceGrenadaGuatemalaHondurasHong Kong SAR, ChinaHungaryIcelandIndiaIndonesiaIran, Islamic Rep.IraqIrelandIsraelItalyJamaicaJapanJordanKazakhstanKenyaKiribatiKorea, Rep.KuwaitKyrgyz RepublicLao PDRLatviaLebanonLesothoLiberiaLithuaniaLuxembourgMacao SAR, ChinaMacedonia, FYRMadagascarMalawiMalaysiaMaldivesMaliMaltaMauritiusMexicoMicronesia, Fed. Sts.MoldovaMongoliaMoroccoMozambiqueNamibiaNepalNetherlandsNew ZealandNicaraguaNigeriaNorwayOmanPakistanPanamaPapua New GuineaParaguayPeruPhilippinesPolandPortugalQatarRomaniaRussian FederationRwandaSamoaSan MarinoSao Tome and PrincipeSenegalSerbiaSeychellesSierra LeoneSingaporeSlovak RepublicSloveniaSolomon IslandsSouth AfricaSpainSri LankaSt. Kitts and NevisSt. LuciaSurinameSwazilandSwedenSwitzerlandSyrian Arab RepublicTajikistanTanzaniaThailandTimor-LesteTogoTrinidad and TobagoTunisiaTurkeyUgandaUkraineUnited Arab EmiratesUnited KingdomUnited StatesUruguayVanuatuVenezuela, RBWest Bank and GazaYemen, Rep.ZambiaZimbabwe Timeline:
This timeline shows a graph from 1992 to 2013 of Kenya. No data until 1991. Number of actual observations by date: 20.
Source name:
World Development Indicators
Source organization:
International Monetary Fund, Government Finance Statistics Yearbook and data files.
Categories, topics:
Public Sector
Last updated:
apr 23, 2017
Indicators value changes by year
Minimum:
16.744 bln
jan 1, 1992
Maximum:
236.372 bln
jan 1, 2012
At the date of observation
Value
Absolute change
Change from previous value
jan 1, 1992
16.744 bln
+16.744 bln
0.0%
jan 1, 1993
19.117 bln
+2.373 bln
14.17%
jan 1, 1994
21.61 bln
+2.493 bln
13.04%
jan 1, 1995
24.861 bln
+3.251 bln
15.04%
jan 1, 1996
33.477 bln
+8.616 bln
34.66%
jan 1, 1997
38.362 bln
+4.885 bln
14.59%
jan 1, 1998
42.569 bln
+4.207 bln
10.97%
jan 1, 2001
89.673 bln
+47.104 bln
110.65%
jan 1, 2002
96.345 bln
+6.671 bln
7.44%
jan 1, 2003
110.418 bln
+14.073 bln
14.61%
jan 1, 2004
100.364 bln
-10.054 bln
-9.11%
jan 1, 2005
131.673 bln
+31.309 bln
31.2%
jan 1, 2006
154.062 bln
+22.389 bln
17.0%
jan 1, 2007
145.538 bln
-8.524 bln
-5.53%
jan 1, 2008
155.425 bln
+9.887 bln
6.79%
jan 1, 2009
169.892 bln
+14.468 bln
9.31%
jan 1, 2010
184.224 bln
+14.331 bln
8.44%
jan 1, 2011
217.671 bln
+33.447 bln
18.16%
jan 1, 2012
236.372 bln
+18.701 bln
8.59%
jan 1, 2013
211.123 bln
-25.249 bln
-10.68%
Ranking of countries by current statistics by years


Comments: