29
/
en
AIzaSyAYiBZKx7MnpbEhh9jyipgxe19OcubqV5w
April 1, 2024
182799
Macao SAR, China
MAC
true
2
1
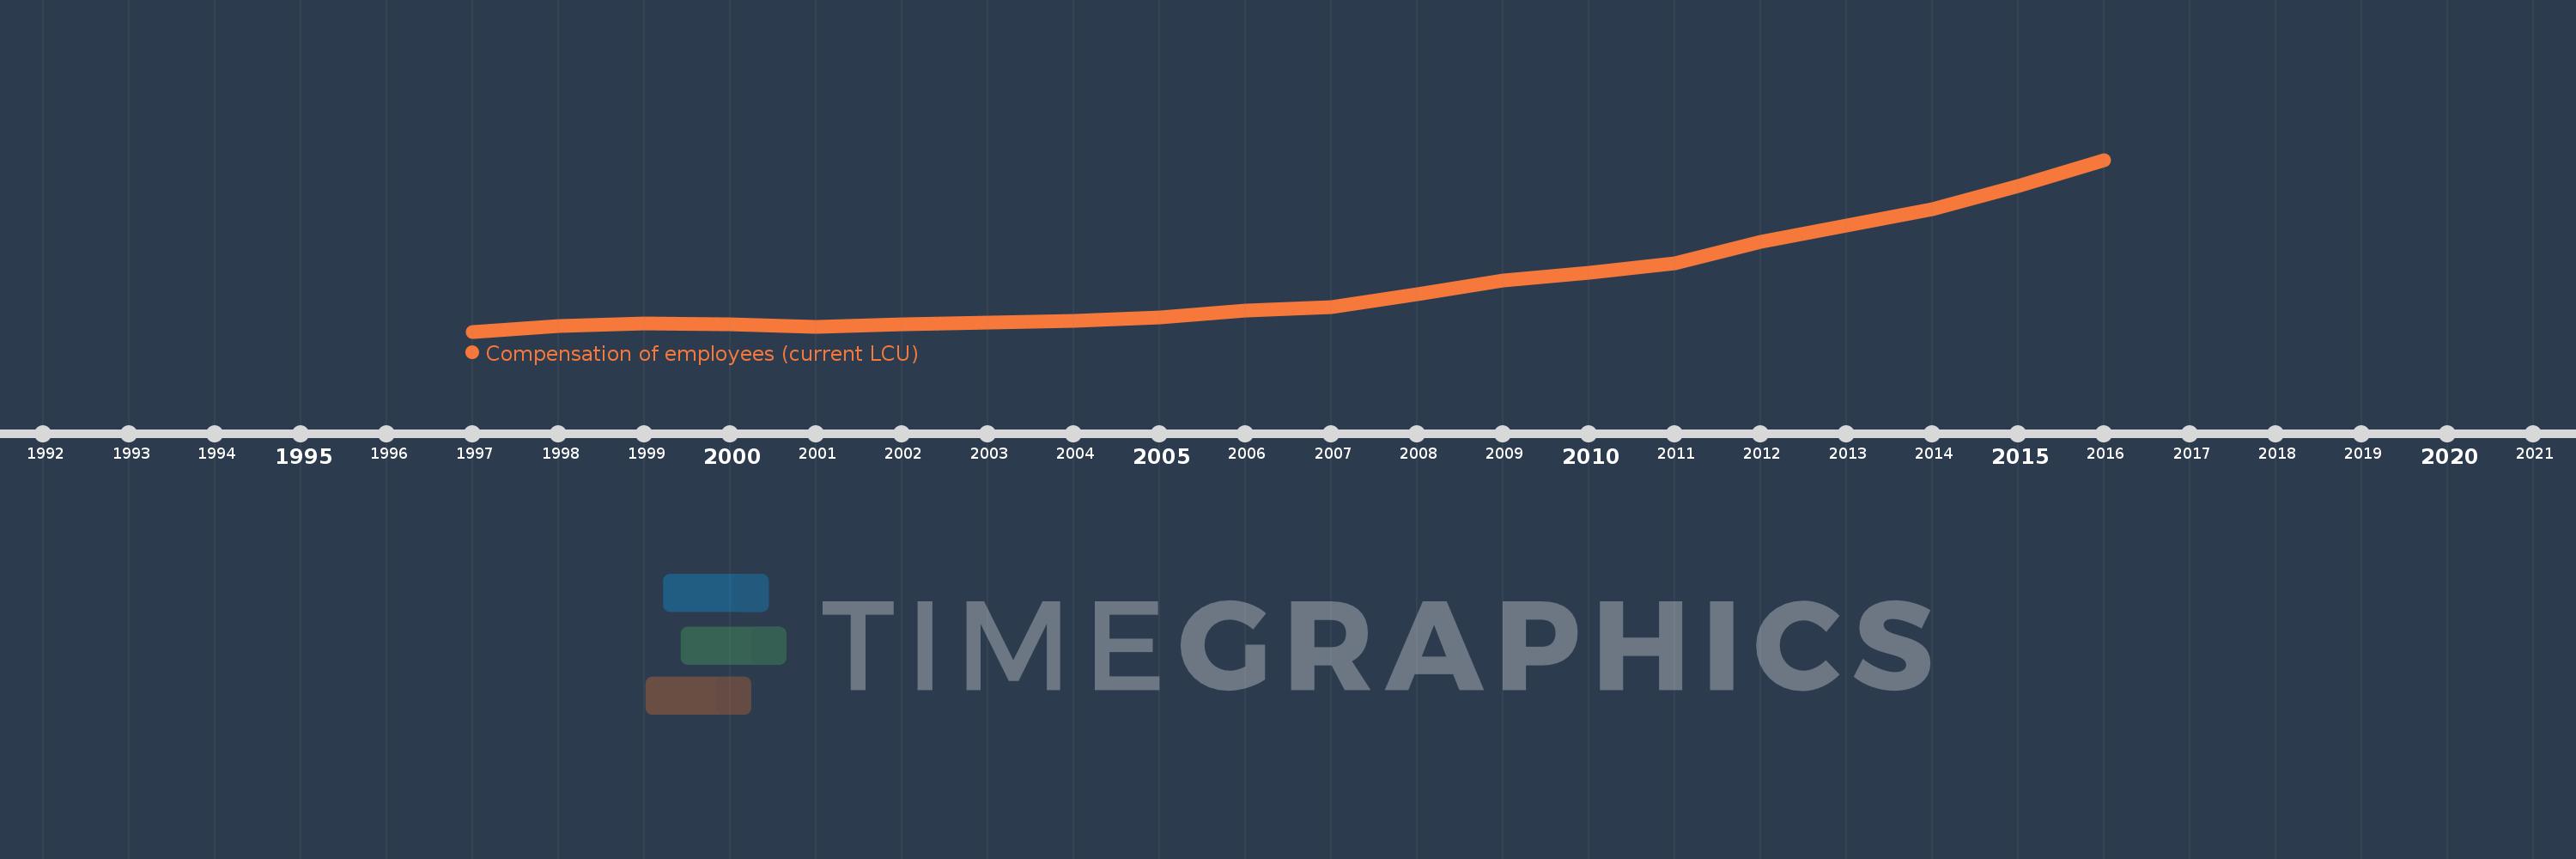
Compensation of employees (current LCU)
2016,2015,2014,2013,2012,2011,2010,2009,2008,2007,2006,2005,2004,2003,2002,2001,2000,1999,1998,1997
This statistics in other country:
AfghanistanAlbaniaAlgeriaAngolaAntigua and BarbudaArmeniaAustraliaAustriaAzerbaijanBahamas, TheBahrainBangladeshBarbadosBelarusBelgiumBelizeBeninBhutanBoliviaBosnia and HerzegovinaBotswanaBrazilBulgariaBurkina FasoBurundiCabo VerdeCambodiaCanadaCentral African RepublicChileColombiaCongo, Dem. Rep.Congo, Rep.Costa RicaCote d'IvoireCroatiaCyprusCzech RepublicDenmarkDominicaDominican RepublicEgypt, Arab Rep.El SalvadorEquatorial GuineaEstoniaEthiopiaFijiFinlandFranceGambia, TheGeorgiaGermanyGhanaGreeceGrenadaGuatemalaHondurasHong Kong SAR, ChinaHungaryIcelandIndiaIndonesiaIran, Islamic Rep.IraqIrelandIsraelItalyJamaicaJapanJordanKazakhstanKenyaKiribatiKorea, Rep.KuwaitKyrgyz RepublicLao PDRLatviaLebanonLesothoLiberiaLithuaniaLuxembourgMacao SAR, ChinaMacedonia, FYRMadagascarMalawiMalaysiaMaldivesMaliMaltaMauritiusMexicoMicronesia, Fed. Sts.MoldovaMongoliaMoroccoMozambiqueNamibiaNepalNetherlandsNew ZealandNicaraguaNigeriaNorwayOmanPakistanPanamaPapua New GuineaParaguayPeruPhilippinesPolandPortugalQatarRomaniaRussian FederationRwandaSamoaSan MarinoSao Tome and PrincipeSenegalSerbiaSeychellesSierra LeoneSingaporeSlovak RepublicSloveniaSolomon IslandsSouth AfricaSpainSri LankaSt. Kitts and NevisSt. LuciaSurinameSwazilandSwedenSwitzerlandSyrian Arab RepublicTajikistanTanzaniaThailandTimor-LesteTogoTrinidad and TobagoTunisiaTurkeyUgandaUkraineUnited Arab EmiratesUnited KingdomUnited StatesUruguayVanuatuVenezuela, RBWest Bank and GazaYemen, Rep.ZambiaZimbabwe Timeline:
This timeline shows a graph from 1997 to 2016 of Macao SAR, China. No data until 1996. Number of actual observations by date: 20.
Source name:
World Development Indicators
Source organization:
International Monetary Fund, Government Finance Statistics Yearbook and data files.
Categories, topics:
Public Sector
Last updated:
apr 23, 2017
Indicators value changes by year
Minimum:
3.992 bln
jan 1, 1997
Maximum:
16.92 bln
jan 1, 2016
At the date of observation
Value
Absolute change
Change from previous value
jan 1, 1997
3.992 bln
+3.992 bln
0.0%
jan 1, 1998
4.399 bln
+407.41 mln
10.21%
jan 1, 1999
4.622 bln
+222.18 mln
5.05%
jan 1, 2000
4.544 bln
-77.656 mln
-1.68%
jan 1, 2001
4.373 bln
-170.853 mln
-3.76%
jan 1, 2002
4.524 bln
+150.435 mln
3.44%
jan 1, 2003
4.648 bln
+124.388 mln
2.75%
jan 1, 2004
4.822 bln
+173.899 mln
3.74%
jan 1, 2005
5.03 bln
+208.424 mln
4.32%
jan 1, 2006
5.545 bln
+514.752 mln
10.23%
jan 1, 2007
5.861 bln
+316.0 mln
5.7%
jan 1, 2008
6.786 bln
+925.035 mln
15.78%
jan 1, 2009
7.847 bln
+1.061 bln
15.64%
jan 1, 2010
8.402 bln
+554.236 mln
7.06%
jan 1, 2011
9.15 bln
+748.595 mln
8.91%
jan 1, 2012
10.718 bln
+1.568 bln
17.13%
jan 1, 2013
11.944 bln
+1.226 bln
11.44%
jan 1, 2014
13.204 bln
+1.26 bln
10.55%
jan 1, 2015
14.922 bln
+1.718 bln
13.01%
jan 1, 2016
16.92 bln
+1.999 bln
13.39%
Ranking of countries by current statistics by years


Comments: