29
/
en
AIzaSyAYiBZKx7MnpbEhh9jyipgxe19OcubqV5w
April 1, 2024
137771
Georgia
GEO
true
2
1
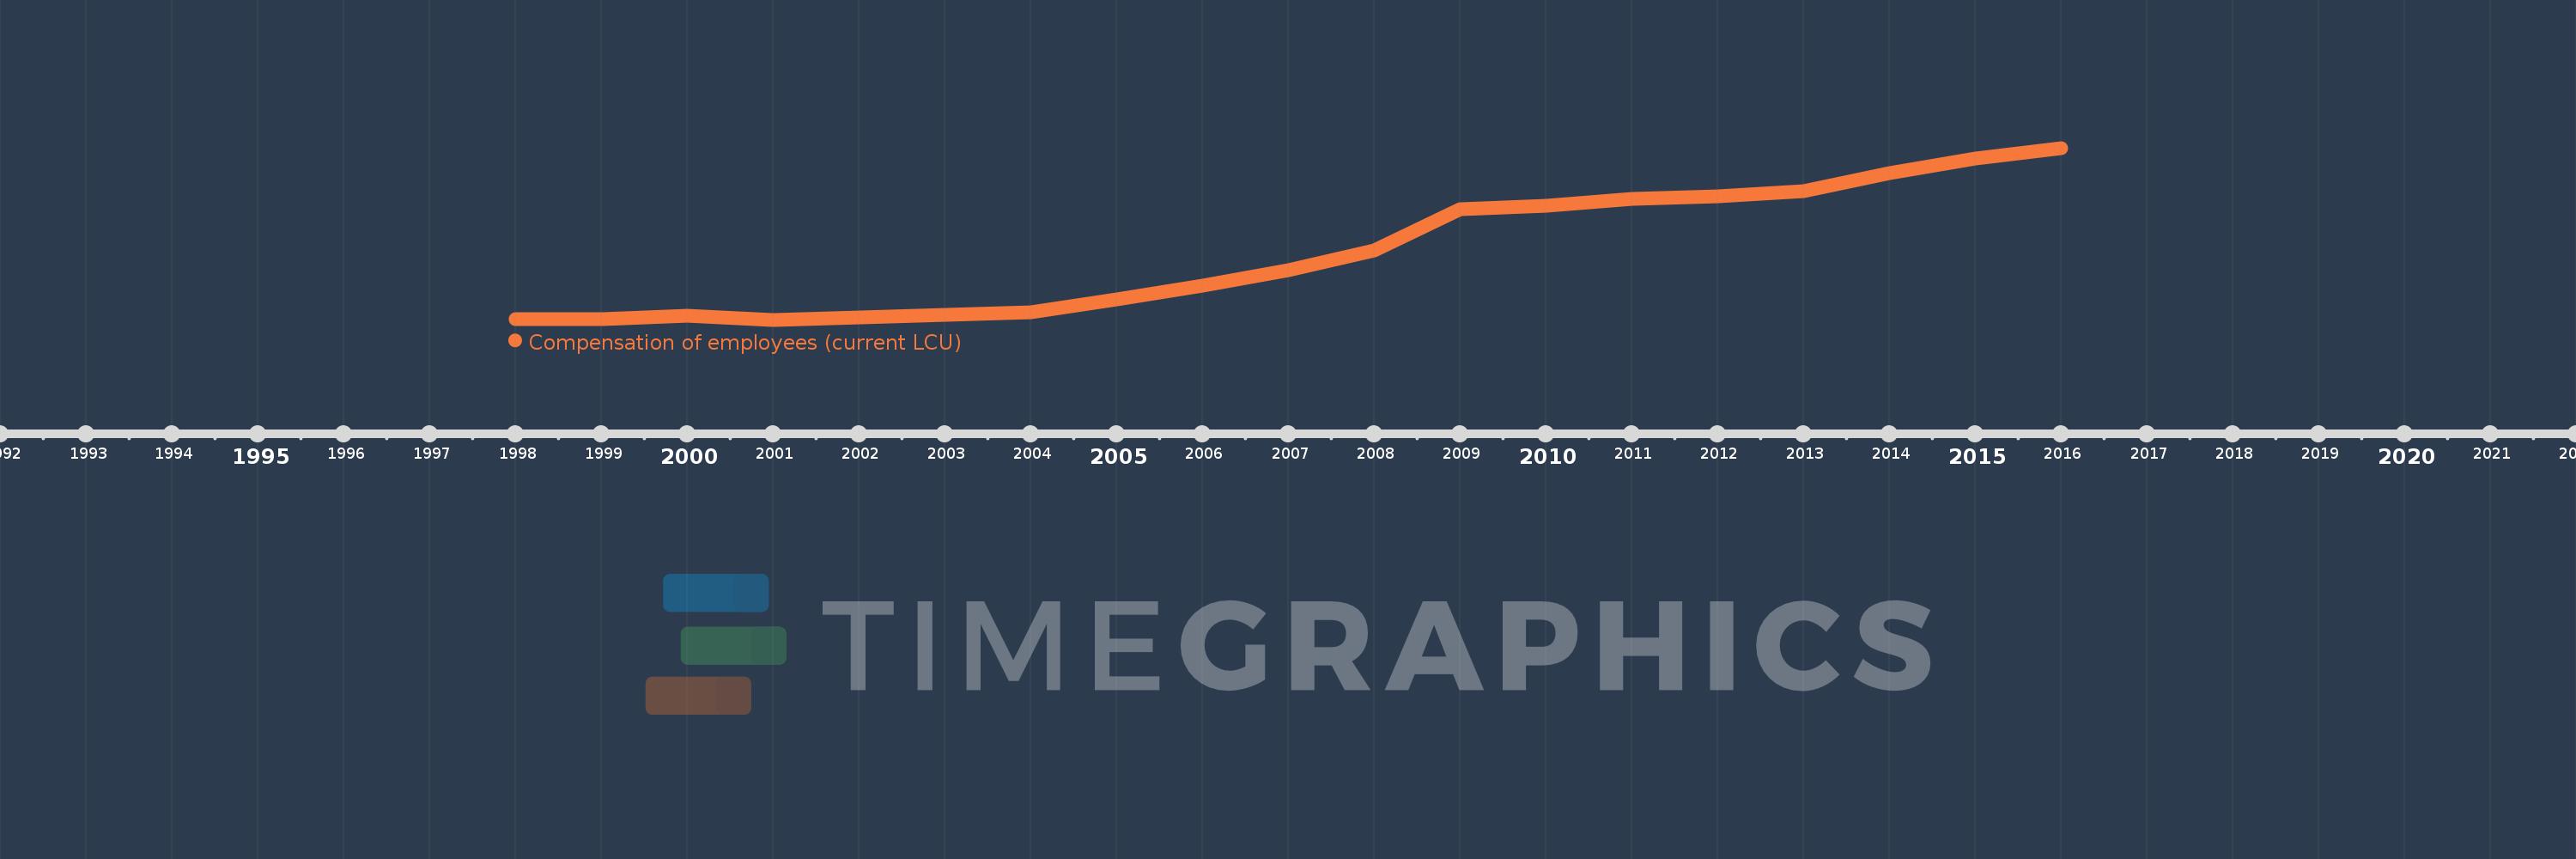
Compensation of employees (current LCU)
2016,2015,2014,2013,2012,2011,2010,2009,2008,2007,2006,2005,2004,2003,2002,2001,2000,1999,1998
This statistics in other country:
AfghanistanAlbaniaAlgeriaAngolaAntigua and BarbudaArmeniaAustraliaAustriaAzerbaijanBahamas, TheBahrainBangladeshBarbadosBelarusBelgiumBelizeBeninBhutanBoliviaBosnia and HerzegovinaBotswanaBrazilBulgariaBurkina FasoBurundiCabo VerdeCambodiaCanadaCentral African RepublicChileColombiaCongo, Dem. Rep.Congo, Rep.Costa RicaCote d'IvoireCroatiaCyprusCzech RepublicDenmarkDominicaDominican RepublicEgypt, Arab Rep.El SalvadorEquatorial GuineaEstoniaEthiopiaFijiFinlandFranceGambia, TheGeorgiaGermanyGhanaGreeceGrenadaGuatemalaHondurasHong Kong SAR, ChinaHungaryIcelandIndiaIndonesiaIran, Islamic Rep.IraqIrelandIsraelItalyJamaicaJapanJordanKazakhstanKenyaKiribatiKorea, Rep.KuwaitKyrgyz RepublicLao PDRLatviaLebanonLesothoLiberiaLithuaniaLuxembourgMacao SAR, ChinaMacedonia, FYRMadagascarMalawiMalaysiaMaldivesMaliMaltaMauritiusMexicoMicronesia, Fed. Sts.MoldovaMongoliaMoroccoMozambiqueNamibiaNepalNetherlandsNew ZealandNicaraguaNigeriaNorwayOmanPakistanPanamaPapua New GuineaParaguayPeruPhilippinesPolandPortugalQatarRomaniaRussian FederationRwandaSamoaSan MarinoSao Tome and PrincipeSenegalSerbiaSeychellesSierra LeoneSingaporeSlovak RepublicSloveniaSolomon IslandsSouth AfricaSpainSri LankaSt. Kitts and NevisSt. LuciaSurinameSwazilandSwedenSwitzerlandSyrian Arab RepublicTajikistanTanzaniaThailandTimor-LesteTogoTrinidad and TobagoTunisiaTurkeyUgandaUkraineUnited Arab EmiratesUnited KingdomUnited StatesUruguayVanuatuVenezuela, RBWest Bank and GazaYemen, Rep.ZambiaZimbabwe Timeline:
This timeline shows a graph from 1998 to 2016 of Georgia. No data until 1997. Number of actual observations by date: 19.
Source name:
World Development Indicators
Source organization:
International Monetary Fund, Government Finance Statistics Yearbook and data files.
Categories, topics:
Public Sector
Last updated:
apr 23, 2017
Indicators value changes by year
Minimum:
76.8 mln
jan 1, 2001
Maximum:
1.377 bln
jan 1, 2016
At the date of observation
Value
Absolute change
Change from previous value
jan 1, 1998
79.1 mln
+79.1 mln
0.0%
jan 1, 1999
80.4 mln
+1.3 mln
1.64%
jan 1, 2000
107.2 mln
+26.8 mln
33.33%
jan 1, 2001
76.8 mln
-30.4 mln
-28.36%
jan 1, 2002
97.4 mln
+20.6 mln
26.82%
jan 1, 2003
112.0 mln
+14.6 mln
14.99%
jan 1, 2004
131.5 mln
+19.5 mln
17.41%
jan 1, 2005
233.0 mln
+101.5 mln
77.19%
jan 1, 2006
336.7 mln
+103.7 mln
44.51%
jan 1, 2007
451.5 mln
+114.8 mln
34.1%
jan 1, 2008
603.5 mln
+152.0 mln
33.67%
jan 1, 2009
913.1 mln
+309.6 mln
51.3%
jan 1, 2010
941.6 mln
+28.5 mln
3.12%
jan 1, 2011
993.5 mln
+51.9 mln
5.51%
jan 1, 2012
1.012 bln
+19.0 mln
1.91%
jan 1, 2013
1.049 bln
+36.9 mln
3.64%
jan 1, 2014
1.188 bln
+138.2 mln
13.17%
jan 1, 2015
1.296 bln
+108.6 mln
9.14%
jan 1, 2016
1.377 bln
+80.6 mln
6.22%
Ranking of countries by current statistics by years


Comments: