29
/
en
AIzaSyAYiBZKx7MnpbEhh9jyipgxe19OcubqV5w
April 1, 2024
77998
Bangladesh
BGD
true
2
1
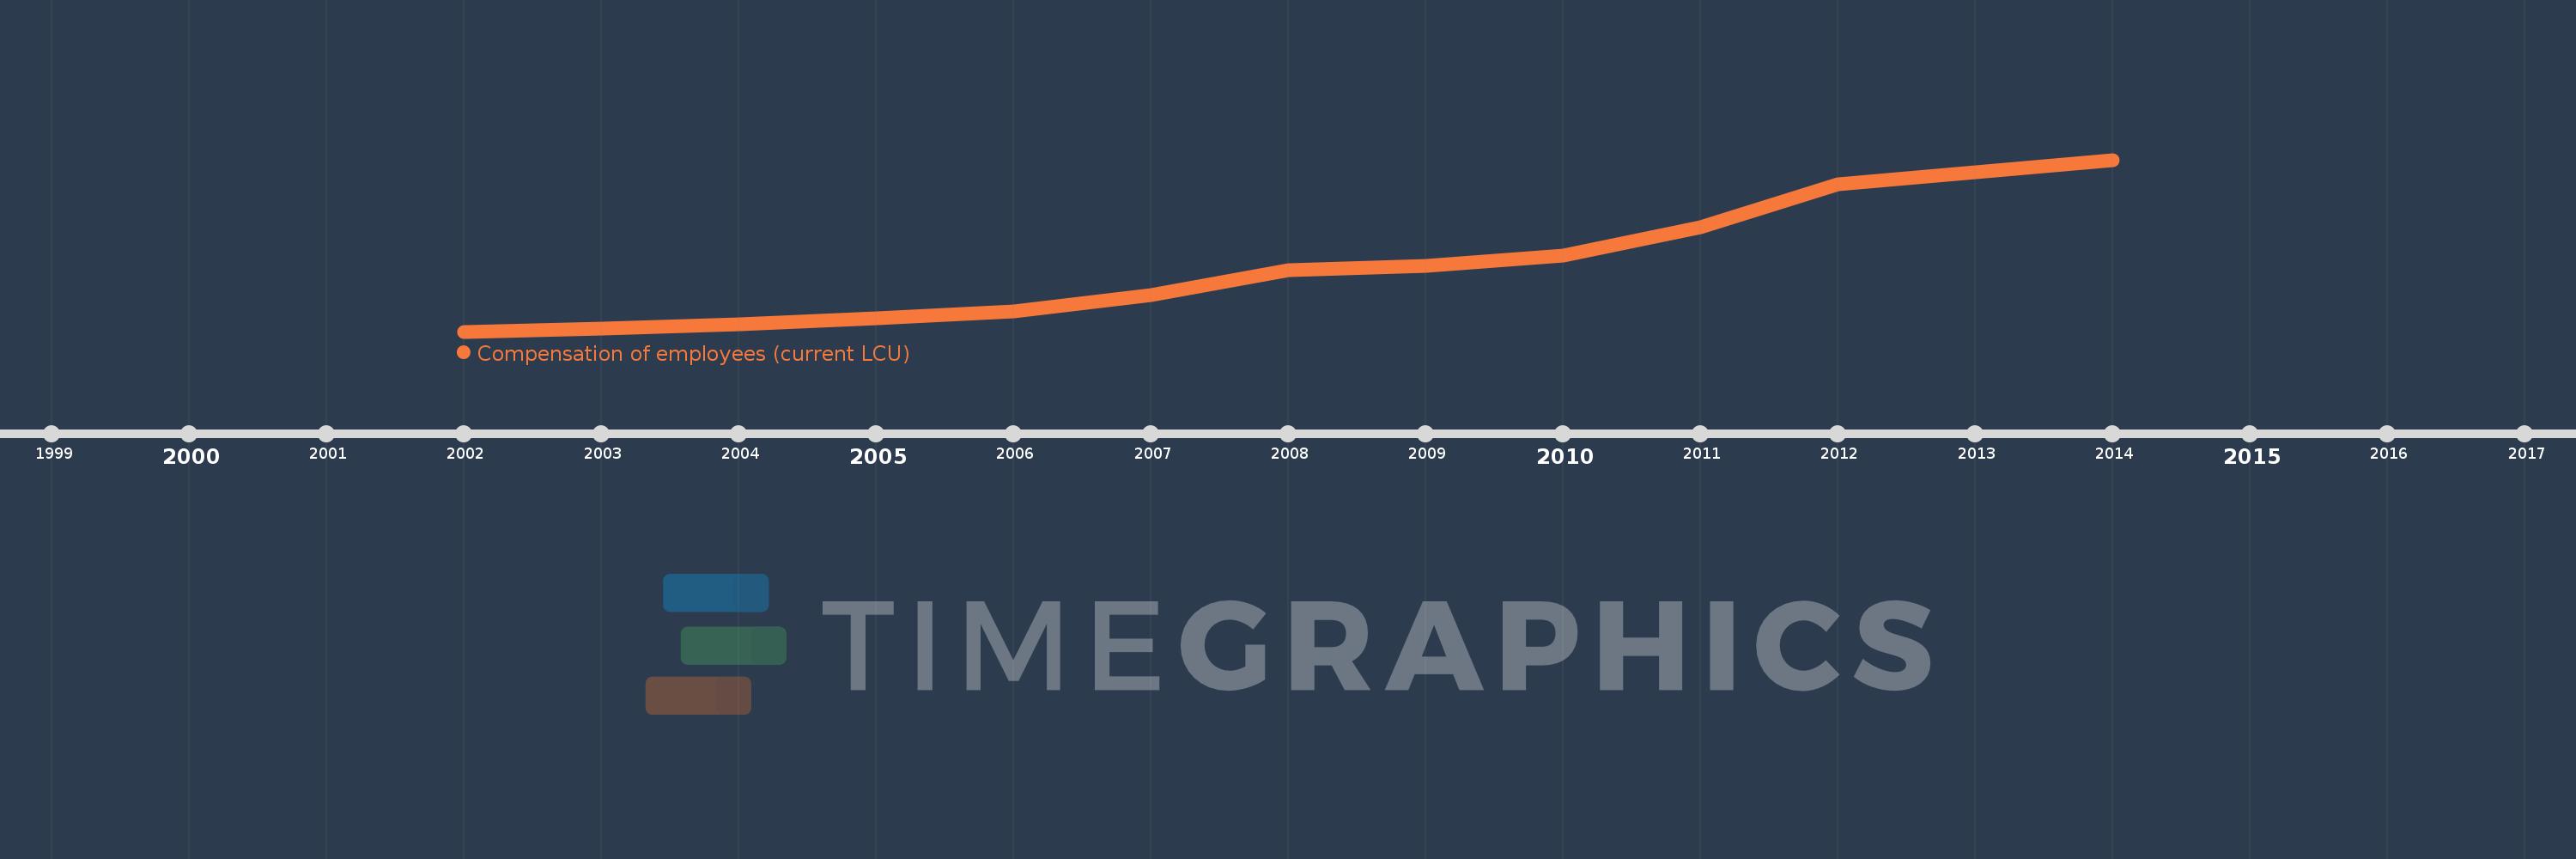
Compensation of employees (current LCU)
2014,2013,2012,2011,2010,2009,2008,2007,2006,2005,2004,2003,2002
This statistics in other country:
AfghanistanAlbaniaAlgeriaAngolaAntigua and BarbudaArmeniaAustraliaAustriaAzerbaijanBahamas, TheBahrainBangladeshBarbadosBelarusBelgiumBelizeBeninBhutanBoliviaBosnia and HerzegovinaBotswanaBrazilBulgariaBurkina FasoBurundiCabo VerdeCambodiaCanadaCentral African RepublicChileColombiaCongo, Dem. Rep.Congo, Rep.Costa RicaCote d'IvoireCroatiaCyprusCzech RepublicDenmarkDominicaDominican RepublicEgypt, Arab Rep.El SalvadorEquatorial GuineaEstoniaEthiopiaFijiFinlandFranceGambia, TheGeorgiaGermanyGhanaGreeceGrenadaGuatemalaHondurasHong Kong SAR, ChinaHungaryIcelandIndiaIndonesiaIran, Islamic Rep.IraqIrelandIsraelItalyJamaicaJapanJordanKazakhstanKenyaKiribatiKorea, Rep.KuwaitKyrgyz RepublicLao PDRLatviaLebanonLesothoLiberiaLithuaniaLuxembourgMacao SAR, ChinaMacedonia, FYRMadagascarMalawiMalaysiaMaldivesMaliMaltaMauritiusMexicoMicronesia, Fed. Sts.MoldovaMongoliaMoroccoMozambiqueNamibiaNepalNetherlandsNew ZealandNicaraguaNigeriaNorwayOmanPakistanPanamaPapua New GuineaParaguayPeruPhilippinesPolandPortugalQatarRomaniaRussian FederationRwandaSamoaSan MarinoSao Tome and PrincipeSenegalSerbiaSeychellesSierra LeoneSingaporeSlovak RepublicSloveniaSolomon IslandsSouth AfricaSpainSri LankaSt. Kitts and NevisSt. LuciaSurinameSwazilandSwedenSwitzerlandSyrian Arab RepublicTajikistanTanzaniaThailandTimor-LesteTogoTrinidad and TobagoTunisiaTurkeyUgandaUkraineUnited Arab EmiratesUnited KingdomUnited StatesUruguayVanuatuVenezuela, RBWest Bank and GazaYemen, Rep.ZambiaZimbabwe Timeline:
This timeline shows a graph from 2002 to 2014 of Bangladesh. No data until 2001. Number of actual observations by date: 13.
Source name:
World Development Indicators
Source organization:
International Monetary Fund, Government Finance Statistics Yearbook and data files.
Categories, topics:
Public Sector
Last updated:
apr 23, 2017
Indicators value changes by year
Minimum:
62.318 bln
jan 1, 2002
Maximum:
218.807 bln
jan 1, 2014
At the date of observation
Value
Absolute change
Change from previous value
jan 1, 2002
62.318 bln
+62.318 bln
0.0%
jan 1, 2003
65.394 bln
+3.076 bln
4.94%
jan 1, 2004
69.137 bln
+3.743 bln
5.72%
jan 1, 2005
74.314 bln
+5.177 bln
7.49%
jan 1, 2006
80.729 bln
+6.415 bln
8.63%
jan 1, 2007
95.703 bln
+14.974 bln
18.55%
jan 1, 2008
118.302 bln
+22.599 bln
23.61%
jan 1, 2009
122.159 bln
+3.858 bln
3.26%
jan 1, 2010
131.685 bln
+9.525 bln
7.8%
jan 1, 2011
157.142 bln
+25.457 bln
19.33%
jan 1, 2012
196.28 bln
+39.139 bln
24.91%
jan 1, 2013
207.215 bln
+10.935 bln
5.57%
jan 1, 2014
218.807 bln
+11.592 bln
5.59%
Ranking of countries by current statistics by years


Comments: