30
/
AIzaSyAYiBZKx7MnpbEhh9jyipgxe19OcubqV5w
April 1, 2024
75044
Azerbaijan
AZE
true
2
1
Gross capital formation (constant LCU)
2015,2014,2013,2012,2011,2010,2009,2008,2007,2006,2005,2004,2003,2002,2001,2000,1999,1998,1997,1996,1995,1994
Public Timelines
FAQ
Menu
Public Timelines
FAQ
For education
For educational institutions
For teachers
For students
Open cabinet
Create
Close
Create a timeline
Public timelines
Library
FAQ
Download
Global statistics library
→
Azerbaijan
→
Gross capital formation (constant LCU)
This statistics in other country:
Albania
Algeria
Angola
Antigua and Barbuda
Argentina
Armenia
Australia
Austria
Azerbaijan
Bahamas, The
Bahrain
Bangladesh
Barbados
Belarus
Belgium
Belize
Benin
Bhutan
Bolivia
Bosnia and Herzegovina
Botswana
Brazil
Brunei Darussalam
Bulgaria
Burkina Faso
Burundi
Cabo Verde
Cambodia
Cameroon
Canada
Chad
Chile
China
Colombia
Comoros
Congo, Dem. Rep.
Congo, Rep.
Costa Rica
Cote d'Ivoire
Croatia
Cuba
Cyprus
Czech Republic
Denmark
Djibouti
Dominican Republic
Ecuador
Egypt, Arab Rep.
El Salvador
Equatorial Guinea
Eritrea
Estonia
Ethiopia
Fiji
Finland
France
Gabon
Gambia, The
Georgia
Germany
Ghana
Greece
Guatemala
Guinea
Guinea-Bissau
Haiti
Honduras
Hong Kong SAR, China
Hungary
Iceland
India
Indonesia
Iran, Islamic Rep.
Ireland
Israel
Italy
Jamaica
Japan
Jordan
Kazakhstan
Kenya
Korea, Rep.
Kosovo
Kuwait
Kyrgyz Republic
Lao PDR
Latvia
Lebanon
Liberia
Lithuania
Luxembourg
Macao SAR, China
Macedonia, FYR
Madagascar
Malawi
Malaysia
Mali
Malta
Mauritania
Mauritius
Mexico
Moldova
Mongolia
Montenegro
Morocco
Mozambique
Namibia
Nepal
Netherlands
New Zealand
Nicaragua
Niger
Nigeria
Norway
Oman
Pakistan
Panama
Papua New Guinea
Paraguay
Peru
Philippines
Poland
Portugal
Puerto Rico
Qatar
Romania
Russian Federation
Rwanda
Saudi Arabia
Senegal
Serbia
Seychelles
Sierra Leone
Singapore
Slovak Republic
Slovenia
Somalia
South Africa
South Sudan
Spain
Sri Lanka
Sudan
Suriname
Swaziland
Sweden
Switzerland
Syrian Arab Republic
Tajikistan
Tanzania
Thailand
Timor-Leste
Togo
Trinidad and Tobago
Tunisia
Turkey
Turkmenistan
Uganda
Ukraine
United Arab Emirates
United Kingdom
United States
Uruguay
Uzbekistan
Vanuatu
Venezuela, RB
Vietnam
West Bank and Gaza
Zambia
Zimbabwe
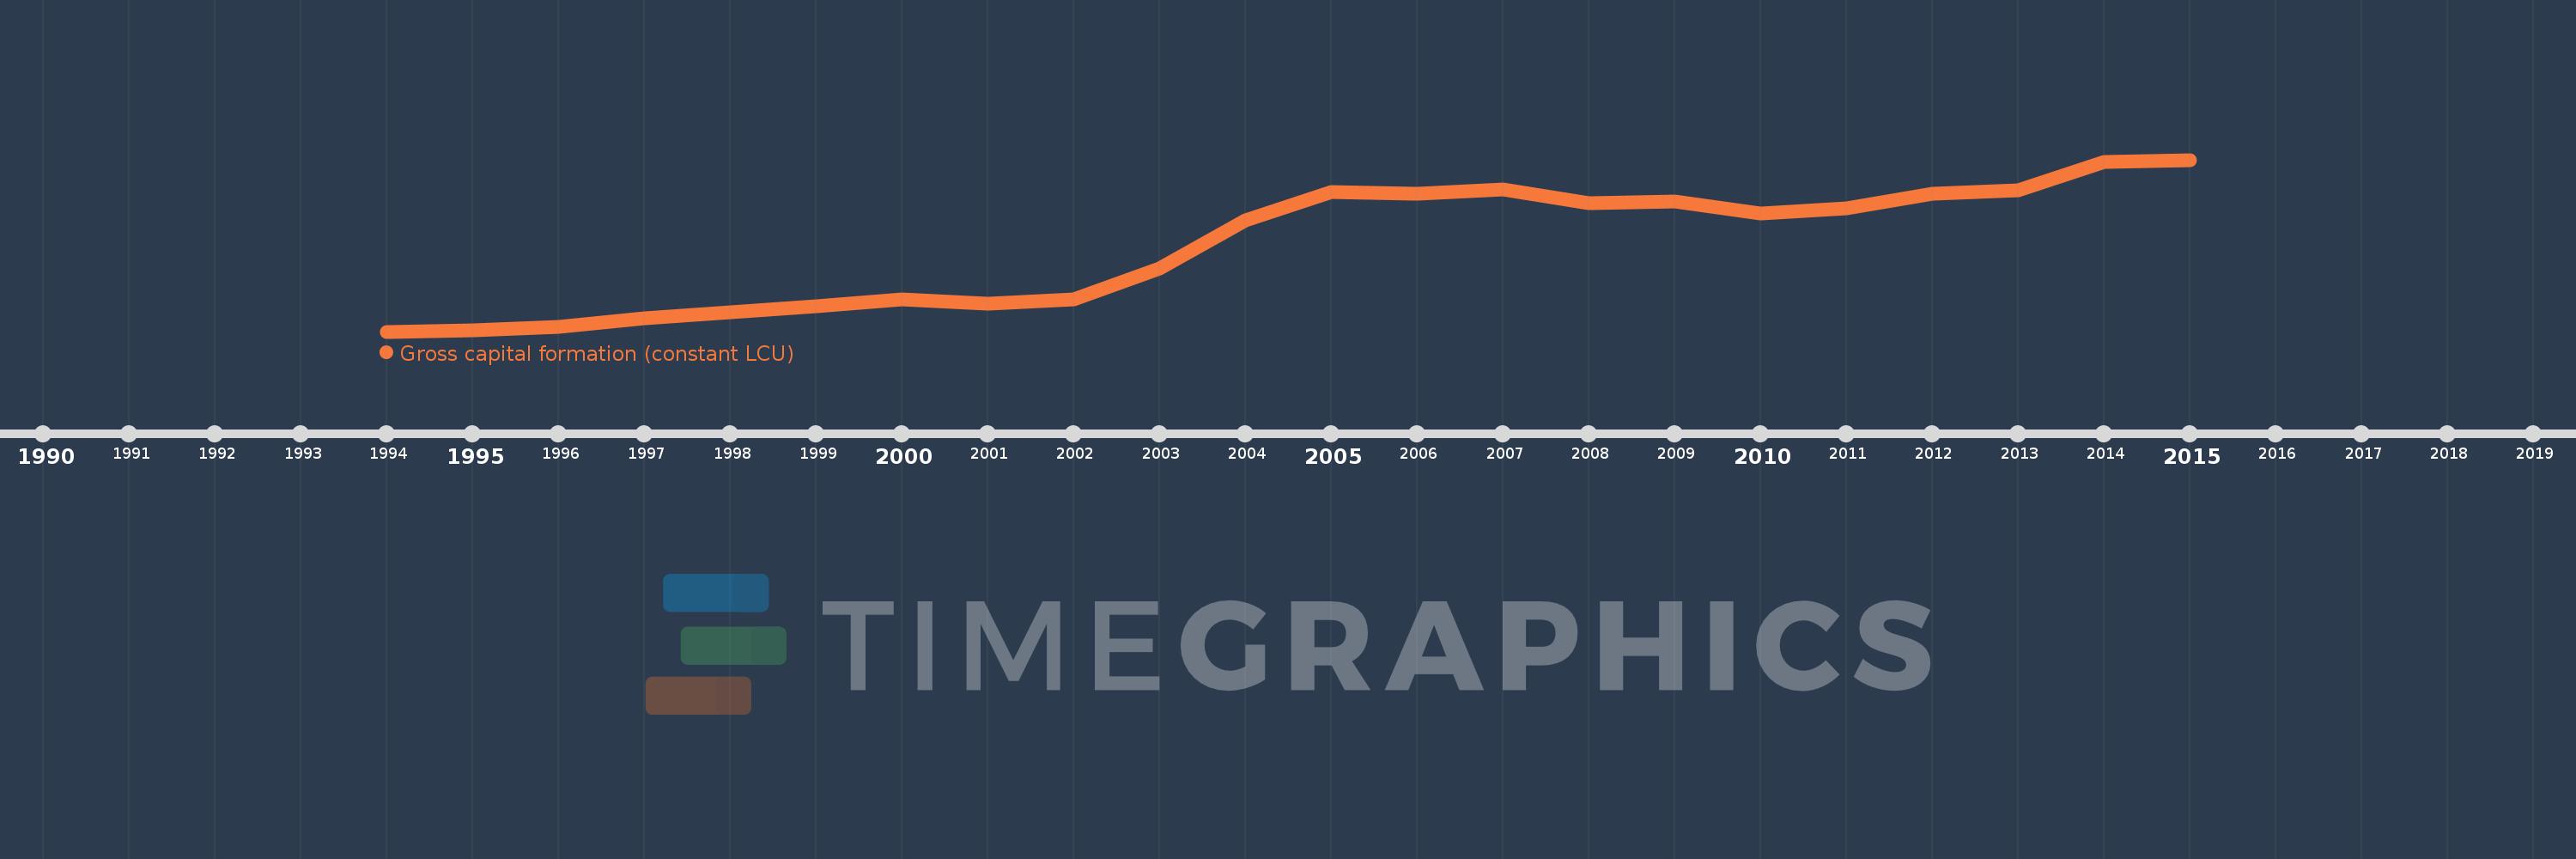
Timeline:
This timeline shows a graph from
1994
to
2015
of Azerbaijan. No data until
1993
. Number of actual observations by date:
22
.
Source name:
World Development Indicators
Source organization:
World Bank national accounts data, and OECD National Accounts data files.
Categories, topics:
Economy & Growth
Last updated:
apr 23, 2017
Indicators value changes by year
Meaning:
2.753 bln
Minimum:
108.593 mln
jan 1, 1994
Maximum:
5.451 bln
jan 1, 2015
At the date of observation
Value
Absolute change
Change from the previous value
jan 1, 1994
108.593 mln
+108.593 mln
0.0%
jan 1, 1995
158.111 mln
+49.518 mln
45.6%
jan 1, 1996
245.231 mln
+87.119 mln
55.1%
jan 1, 1997
518.418 mln
+273.187 mln
111.4%
jan 1, 1998
720.6 mln
+202.183 mln
39.0%
jan 1, 1999
886.338 mln
+165.738 mln
23.0%
jan 1, 2000
1.105 bln
+218.801 mln
24.69%
jan 1, 2001
975.42 mln
-129.72 mln
-11.74%
jan 1, 2002
1.101 bln
+125.882 mln
12.91%
jan 1, 2003
2.067 bln
+965.373 mln
87.66%
jan 1, 2004
3.566 bln
+1.499 bln
72.53%
jan 1, 2005
4.459 bln
+893.22 mln
25.05%
jan 1, 2006
4.401 bln
-58.051 mln
-1.3%
jan 1, 2007
4.519 bln
+118.404 mln
2.69%
jan 1, 2008
4.099 bln
-420.58 mln
-9.31%
jan 1, 2009
4.164 bln
+65.559 mln
1.6%
jan 1, 2010
3.791 bln
-373.147 mln
-8.96%
jan 1, 2011
3.955 bln
+163.563 mln
4.31%
jan 1, 2012
4.4 bln
+445.668 mln
11.27%
jan 1, 2013
4.497 bln
+96.805 mln
2.2%
jan 1, 2014
5.372 bln
+874.55 mln
19.45%
jan 1, 2015
5.451 bln
+79.431 mln
1.48%
Ranking of countries by current statistics by years
About & Feedback
Terms
Privacy
Library
2024
©
Time.Graphics
Support 24/7
Cabinet
Get premium
Donate
The service accepts bank transfer (ACH, Wire) or cards (Visa, MasterCard, etc). Processed by Stripe.
Secured with SSL
Excellent (Trustpilot Reviews)
Based on 115+ reviews
Write your own review on
Trustpilot.com
