29
/
en
AIzaSyAYiBZKx7MnpbEhh9jyipgxe19OcubqV5w
April 1, 2024
129392
Estonia
EST
true
2
1
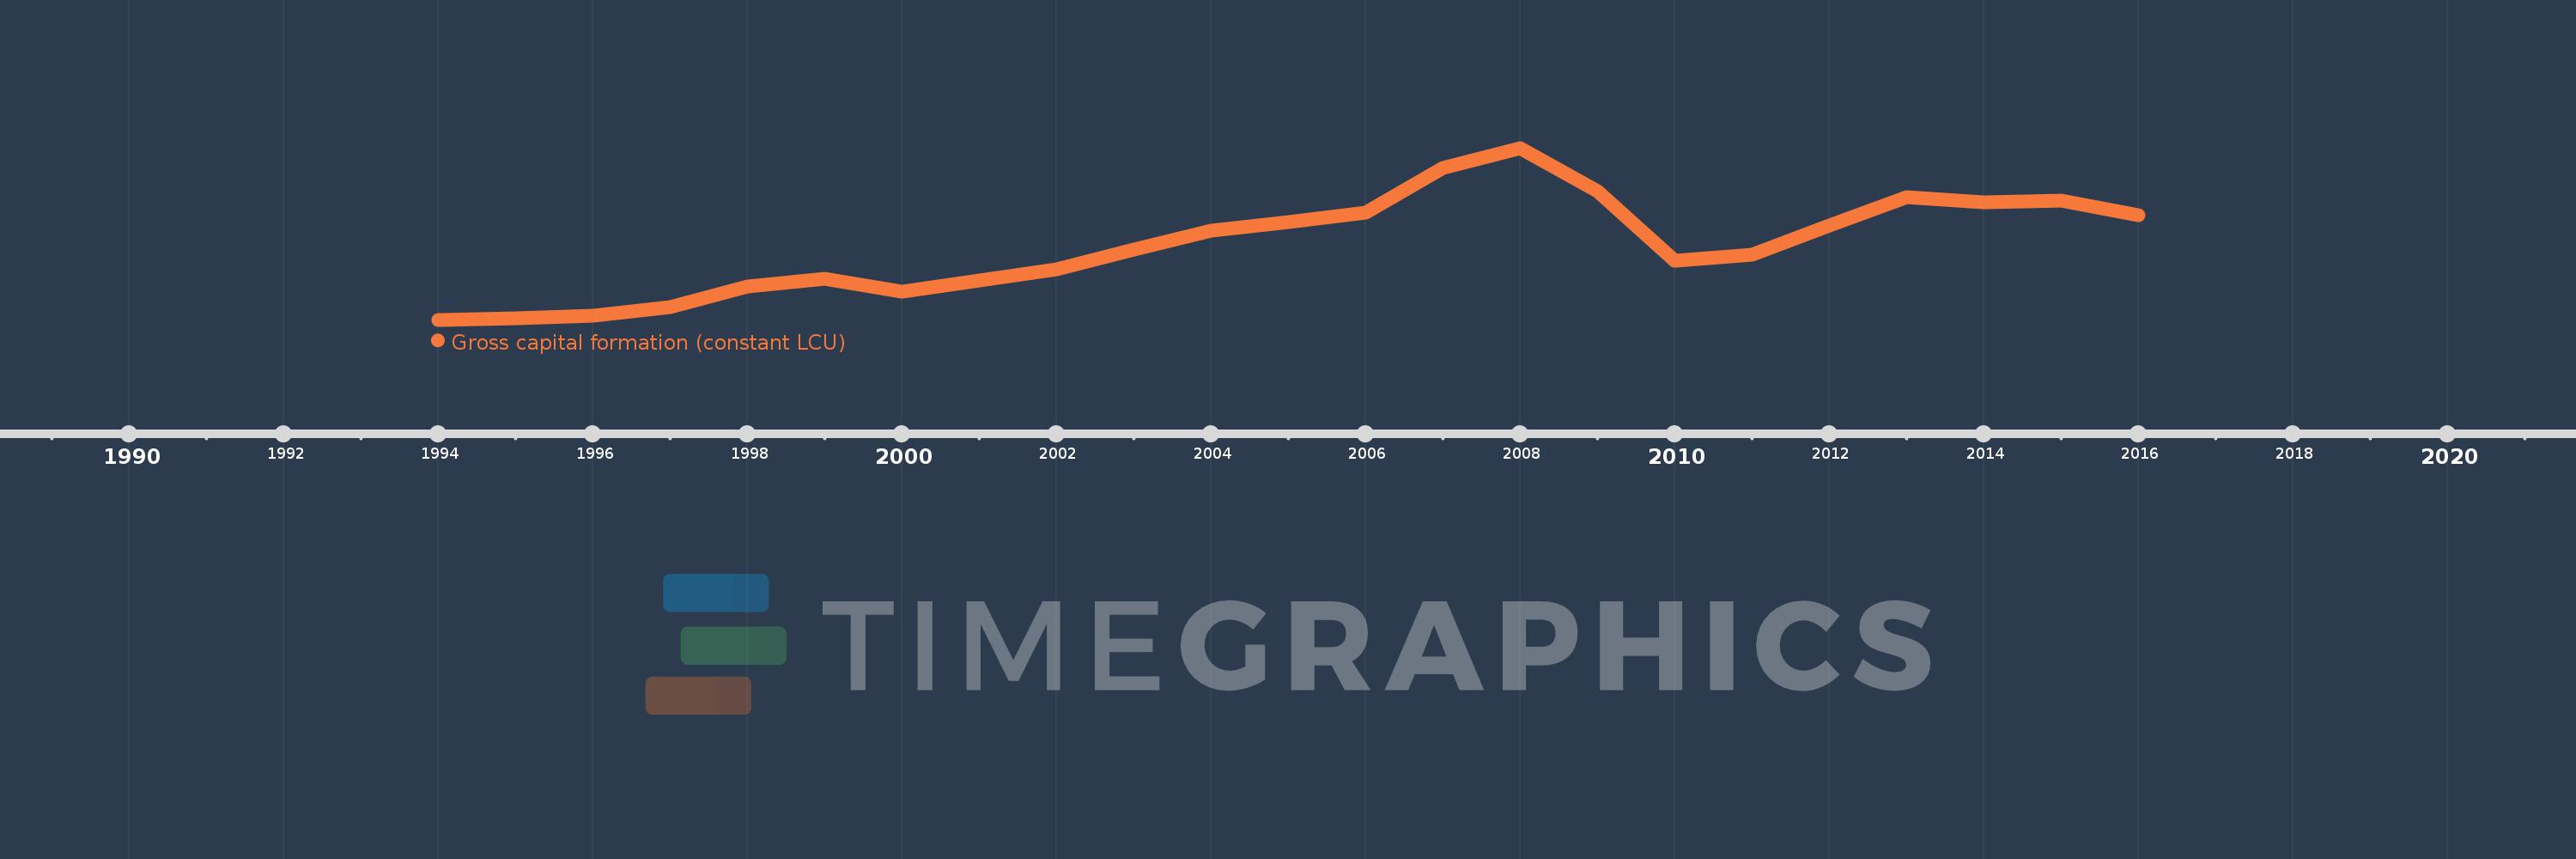
Gross capital formation (constant LCU)
2016,2015,2014,2013,2012,2011,2010,2009,2008,2007,2006,2005,2004,2003,2002,2001,2000,1999,1998,1997,1996,1995,1994
This statistics in other country:
AlbaniaAlgeriaAngolaAntigua and BarbudaArgentinaArmeniaAustraliaAustriaAzerbaijanBahamas, TheBahrainBangladeshBarbadosBelarusBelgiumBelizeBeninBhutanBoliviaBosnia and HerzegovinaBotswanaBrazilBrunei DarussalamBulgariaBurkina FasoBurundiCabo VerdeCambodiaCameroonCanadaChadChileChinaColombiaComorosCongo, Dem. Rep.Congo, Rep.Costa RicaCote d'IvoireCroatiaCubaCyprusCzech RepublicDenmarkDjiboutiDominican RepublicEcuadorEgypt, Arab Rep.El SalvadorEquatorial GuineaEritreaEstoniaEthiopiaFijiFinlandFranceGabonGambia, TheGeorgiaGermanyGhanaGreeceGuatemalaGuineaGuinea-BissauHaitiHondurasHong Kong SAR, ChinaHungaryIcelandIndiaIndonesiaIran, Islamic Rep.IrelandIsraelItalyJamaicaJapanJordanKazakhstanKenyaKorea, Rep.KosovoKuwaitKyrgyz RepublicLao PDRLatviaLebanonLiberiaLithuaniaLuxembourgMacao SAR, ChinaMacedonia, FYRMadagascarMalawiMalaysiaMaliMaltaMauritaniaMauritiusMexicoMoldovaMongoliaMontenegroMoroccoMozambiqueNamibiaNepalNetherlandsNew ZealandNicaraguaNigerNigeriaNorwayOmanPakistanPanamaPapua New GuineaParaguayPeruPhilippinesPolandPortugalPuerto RicoQatarRomaniaRussian FederationRwandaSaudi ArabiaSenegalSerbiaSeychellesSierra LeoneSingaporeSlovak RepublicSloveniaSomaliaSouth AfricaSouth SudanSpainSri LankaSudanSurinameSwazilandSwedenSwitzerlandSyrian Arab RepublicTajikistanTanzaniaThailandTimor-LesteTogoTrinidad and TobagoTunisiaTurkeyTurkmenistanUgandaUkraineUnited Arab EmiratesUnited KingdomUnited StatesUruguayUzbekistanVanuatuVenezuela, RBVietnamWest Bank and GazaZambiaZimbabwe Timeline:
This timeline shows a graph from 1994 to 2016 of Estonia. No data until 1993. Number of actual observations by date: 23.
Source name:
World Development Indicators
Source organization:
World Bank national accounts data, and OECD National Accounts data files.
Categories, topics:
Economy & Growth
Last updated:
apr 23, 2017
Indicators value changes by year
Minimum:
1.169 bln
jan 1, 1994
Maximum:
6.332 bln
jan 1, 2008
At the date of observation
Value
Absolute change
Change from previous value
jan 1, 1994
1.169 bln
+1.169 bln
0.0%
jan 1, 1995
1.21 bln
+40.52 mln
3.46%
jan 1, 1996
1.286 bln
+75.823 mln
6.27%
jan 1, 1997
1.548 bln
+261.99 mln
20.38%
jan 1, 1998
2.166 bln
+617.95 mln
39.93%
jan 1, 1999
2.39 bln
+224.26 mln
10.36%
jan 1, 2000
2.001 bln
-389.17 mln
-16.28%
jan 1, 2001
2.342 bln
+340.79 mln
17.03%
jan 1, 2002
2.689 bln
+347.74 mln
14.85%
jan 1, 2003
3.274 bln
+584.45 mln
21.73%
jan 1, 2004
3.854 bln
+580.51 mln
17.73%
jan 1, 2005
4.094 bln
+240.04 mln
6.23%
jan 1, 2006
4.376 bln
+281.49 mln
6.88%
jan 1, 2007
5.721 bln
+1.345 bln
30.73%
jan 1, 2008
6.332 bln
+611.35 mln
10.69%
jan 1, 2009
5.041 bln
-1.291 bln
-20.39%
jan 1, 2010
2.936 bln
-2.104 bln
-41.75%
jan 1, 2011
3.131 bln
+194.6 mln
6.63%
jan 1, 2012
4.013 bln
+881.74 mln
28.16%
jan 1, 2013
4.842 bln
+829.21 mln
20.66%
jan 1, 2014
4.705 bln
-136.5 mln
-2.82%
jan 1, 2015
4.743 bln
+37.96 mln
0.81%
jan 1, 2016
4.318 bln
-425.72 mln
-8.98%
Ranking of countries by current statistics by years


Comments: