29
/
en
AIzaSyAYiBZKx7MnpbEhh9jyipgxe19OcubqV5w
April 1, 2024
283658
West Bank and Gaza
PSE
true
2
1
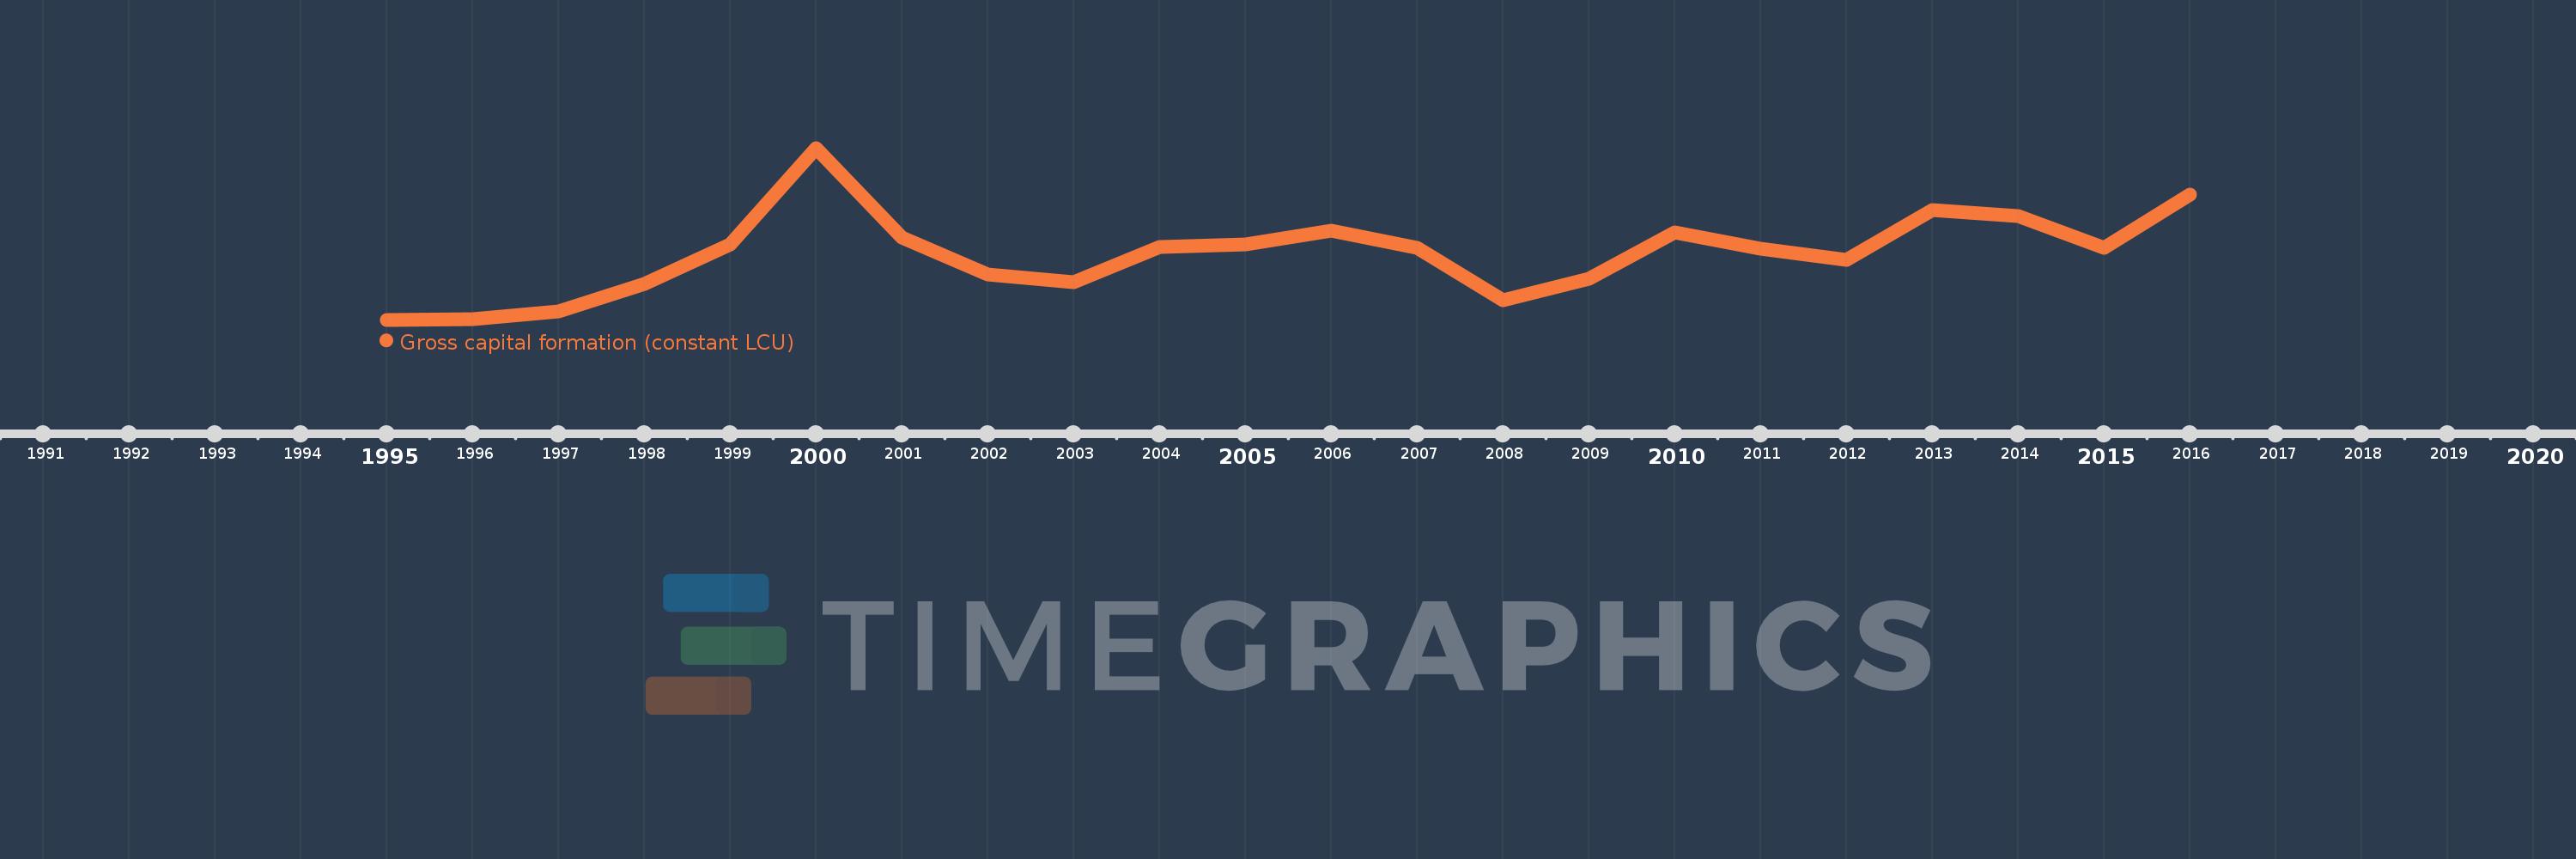
Gross capital formation (constant LCU)
2016,2015,2014,2013,2012,2011,2010,2009,2008,2007,2006,2005,2004,2003,2002,2001,2000,1999,1998,1997,1996,1995
This statistics in other country:
AlbaniaAlgeriaAngolaAntigua and BarbudaArgentinaArmeniaAustraliaAustriaAzerbaijanBahamas, TheBahrainBangladeshBarbadosBelarusBelgiumBelizeBeninBhutanBoliviaBosnia and HerzegovinaBotswanaBrazilBrunei DarussalamBulgariaBurkina FasoBurundiCabo VerdeCambodiaCameroonCanadaChadChileChinaColombiaComorosCongo, Dem. Rep.Congo, Rep.Costa RicaCote d'IvoireCroatiaCubaCyprusCzech RepublicDenmarkDjiboutiDominican RepublicEcuadorEgypt, Arab Rep.El SalvadorEquatorial GuineaEritreaEstoniaEthiopiaFijiFinlandFranceGabonGambia, TheGeorgiaGermanyGhanaGreeceGuatemalaGuineaGuinea-BissauHaitiHondurasHong Kong SAR, ChinaHungaryIcelandIndiaIndonesiaIran, Islamic Rep.IrelandIsraelItalyJamaicaJapanJordanKazakhstanKenyaKorea, Rep.KosovoKuwaitKyrgyz RepublicLao PDRLatviaLebanonLiberiaLithuaniaLuxembourgMacao SAR, ChinaMacedonia, FYRMadagascarMalawiMalaysiaMaliMaltaMauritaniaMauritiusMexicoMoldovaMongoliaMontenegroMoroccoMozambiqueNamibiaNepalNetherlandsNew ZealandNicaraguaNigerNigeriaNorwayOmanPakistanPanamaPapua New GuineaParaguayPeruPhilippinesPolandPortugalPuerto RicoQatarRomaniaRussian FederationRwandaSaudi ArabiaSenegalSerbiaSeychellesSierra LeoneSingaporeSlovak RepublicSloveniaSomaliaSouth AfricaSouth SudanSpainSri LankaSudanSurinameSwazilandSwedenSwitzerlandSyrian Arab RepublicTajikistanTanzaniaThailandTimor-LesteTogoTrinidad and TobagoTunisiaTurkeyTurkmenistanUgandaUkraineUnited Arab EmiratesUnited KingdomUnited StatesUruguayUzbekistanVanuatuVenezuela, RBVietnamWest Bank and GazaZambiaZimbabwe Timeline:
This timeline shows a graph from 1995 to 2016 of West Bank and Gaza. No data until 1994. Number of actual observations by date: 22.
Source name:
World Development Indicators
Source organization:
World Bank national accounts data, and OECD National Accounts data files.
Categories, topics:
Economy & Growth
Last updated:
apr 23, 2017
Indicators value changes by year
Minimum:
3.136 bln
jan 1, 1995
Maximum:
7.758 bln
jan 1, 2000
At the date of observation
Value
Absolute change
Change from previous value
jan 1, 1995
3.136 bln
+3.136 bln
0.0%
jan 1, 1996
3.151 bln
+14.964 mln
0.48%
jan 1, 1997
3.356 bln
+205.066 mln
6.51%
jan 1, 1998
4.093 bln
+736.332 mln
21.94%
jan 1, 1999
5.174 bln
+1.081 bln
26.42%
jan 1, 2000
7.758 bln
+2.584 bln
49.95%
jan 1, 2001
5.35 bln
-2.408 bln
-31.04%
jan 1, 2002
4.356 bln
-994.39 mln
-18.59%
jan 1, 2003
4.157 bln
-198.424 mln
-4.56%
jan 1, 2004
5.083 bln
+925.385 mln
22.26%
jan 1, 2005
5.161 bln
+78.218 mln
1.54%
jan 1, 2006
5.538 bln
+376.799 mln
7.3%
jan 1, 2007
5.072 bln
-466.23 mln
-8.42%
jan 1, 2008
3.65 bln
-1.422 bln
-28.03%
jan 1, 2009
4.246 bln
+595.829 mln
16.32%
jan 1, 2010
5.489 bln
+1.243 bln
29.27%
jan 1, 2011
5.054 bln
-435.037 mln
-7.93%
jan 1, 2012
4.745 bln
-309.216 mln
-6.12%
jan 1, 2013
6.085 bln
+1.34 bln
28.25%
jan 1, 2014
5.936 bln
-148.841 mln
-2.45%
jan 1, 2015
5.064 bln
-872.353 mln
-14.7%
jan 1, 2016
6.51 bln
+1.446 bln
28.55%
Ranking of countries by current statistics by years


Comments: