29
/
en
AIzaSyAYiBZKx7MnpbEhh9jyipgxe19OcubqV5w
April 1, 2024
263529
Timor-Leste
TLS
true
2
1
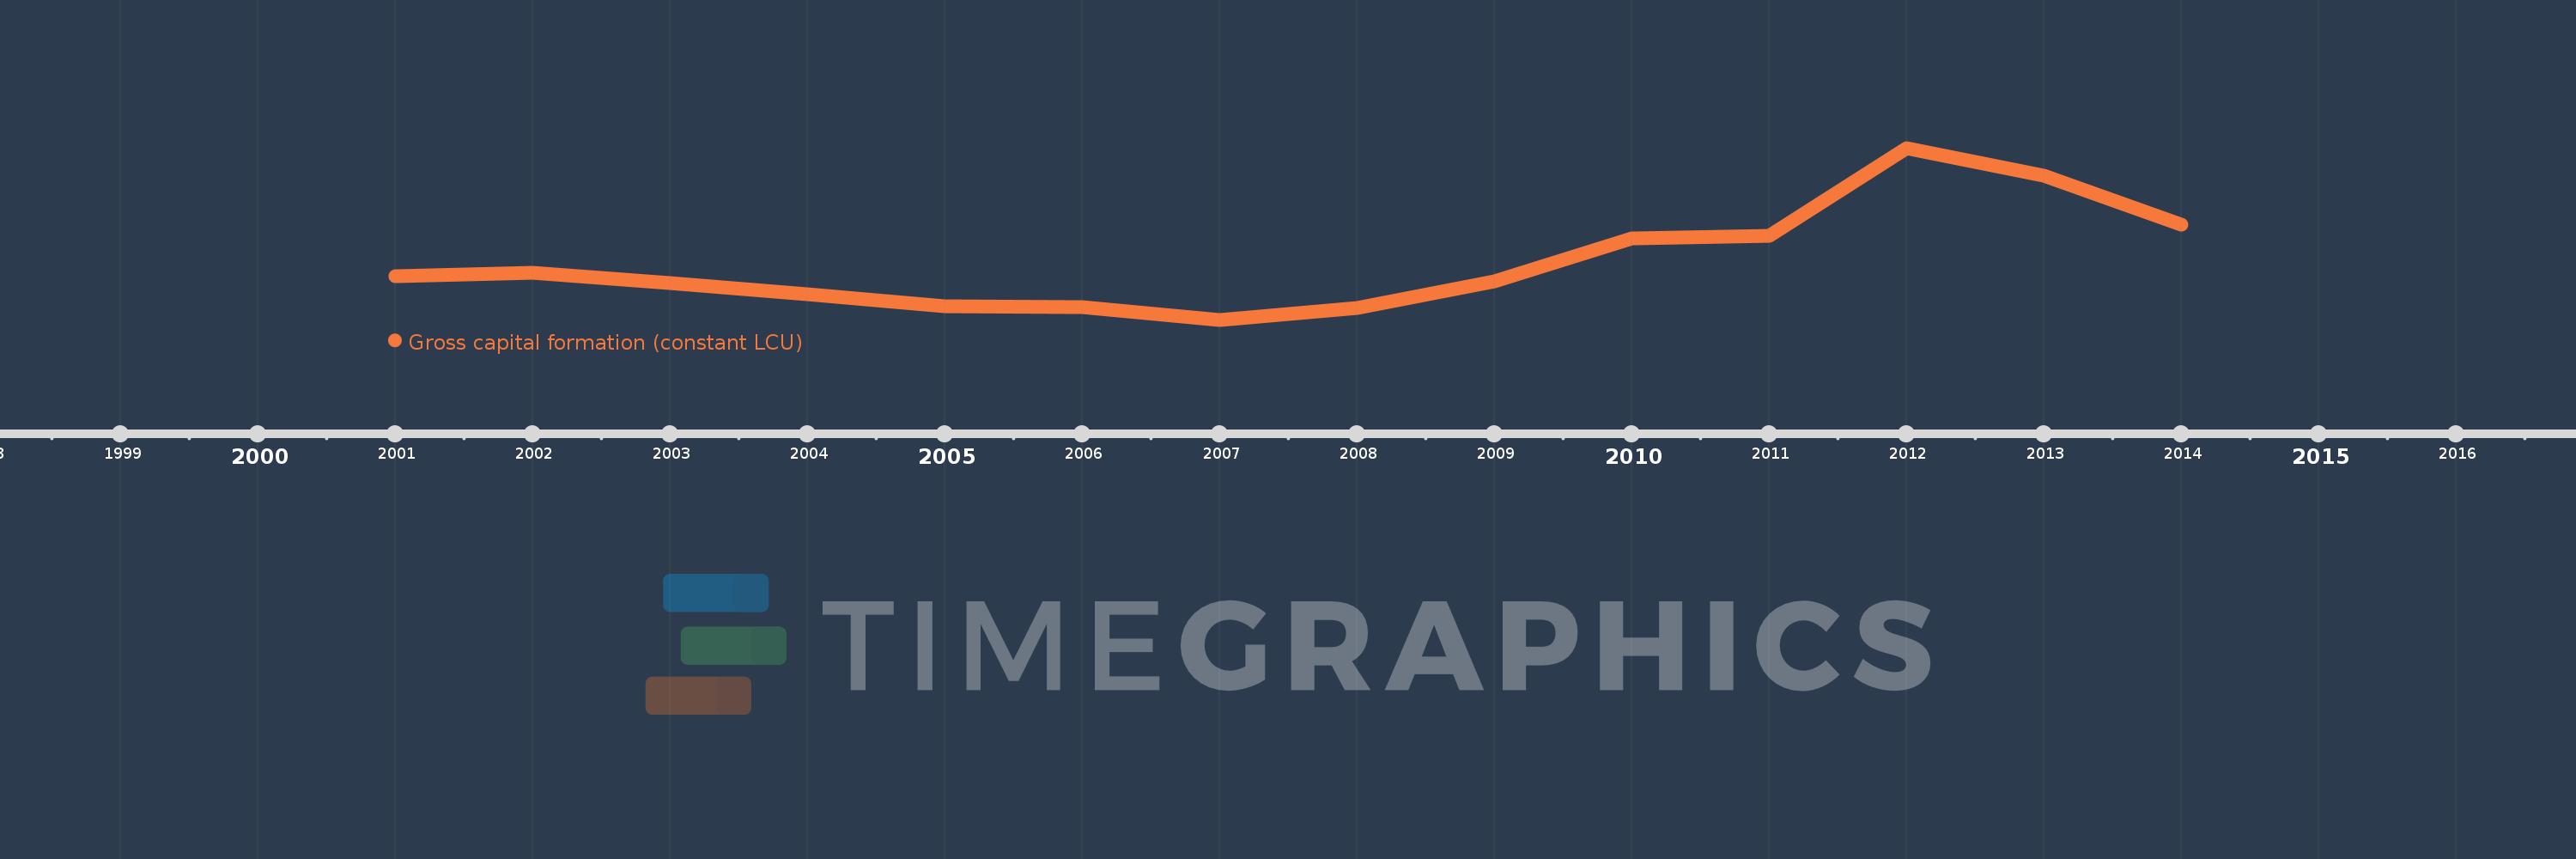
Gross capital formation (constant LCU)
2014,2013,2012,2011,2010,2009,2008,2007,2006,2005,2004,2003,2002,2001
This statistics in other country:
AlbaniaAlgeriaAngolaAntigua and BarbudaArgentinaArmeniaAustraliaAustriaAzerbaijanBahamas, TheBahrainBangladeshBarbadosBelarusBelgiumBelizeBeninBhutanBoliviaBosnia and HerzegovinaBotswanaBrazilBrunei DarussalamBulgariaBurkina FasoBurundiCabo VerdeCambodiaCameroonCanadaChadChileChinaColombiaComorosCongo, Dem. Rep.Congo, Rep.Costa RicaCote d'IvoireCroatiaCubaCyprusCzech RepublicDenmarkDjiboutiDominican RepublicEcuadorEgypt, Arab Rep.El SalvadorEquatorial GuineaEritreaEstoniaEthiopiaFijiFinlandFranceGabonGambia, TheGeorgiaGermanyGhanaGreeceGuatemalaGuineaGuinea-BissauHaitiHondurasHong Kong SAR, ChinaHungaryIcelandIndiaIndonesiaIran, Islamic Rep.IrelandIsraelItalyJamaicaJapanJordanKazakhstanKenyaKorea, Rep.KosovoKuwaitKyrgyz RepublicLao PDRLatviaLebanonLiberiaLithuaniaLuxembourgMacao SAR, ChinaMacedonia, FYRMadagascarMalawiMalaysiaMaliMaltaMauritaniaMauritiusMexicoMoldovaMongoliaMontenegroMoroccoMozambiqueNamibiaNepalNetherlandsNew ZealandNicaraguaNigerNigeriaNorwayOmanPakistanPanamaPapua New GuineaParaguayPeruPhilippinesPolandPortugalPuerto RicoQatarRomaniaRussian FederationRwandaSaudi ArabiaSenegalSerbiaSeychellesSierra LeoneSingaporeSlovak RepublicSloveniaSomaliaSouth AfricaSouth SudanSpainSri LankaSudanSurinameSwazilandSwedenSwitzerlandSyrian Arab RepublicTajikistanTanzaniaThailandTimor-LesteTogoTrinidad and TobagoTunisiaTurkeyTurkmenistanUgandaUkraineUnited Arab EmiratesUnited KingdomUnited StatesUruguayUzbekistanVanuatuVenezuela, RBVietnamWest Bank and GazaZambiaZimbabwe Timeline:
This timeline shows a graph from 2001 to 2014 of Timor-Leste. No data until 2000. Number of actual observations by date: 14.
Source name:
World Development Indicators
Source organization:
World Bank national accounts data, and OECD National Accounts data files.
Categories, topics:
Economy & Growth
Last updated:
apr 23, 2017
Indicators value changes by year
Minimum:
69.0 mln
jan 1, 2007
Maximum:
702.0 mln
jan 1, 2012
At the date of observation
Value
Absolute change
Change from previous value
jan 1, 2001
230.0 mln
+230.0 mln
0.0%
jan 1, 2002
243.0 mln
+13.0 mln
5.65%
jan 1, 2003
203.0 mln
-40.0 mln
-16.46%
jan 1, 2004
163.0 mln
-40.0 mln
-19.7%
jan 1, 2005
119.0 mln
-44.0 mln
-26.99%
jan 1, 2006
116.0 mln
-3.0 mln
-2.52%
jan 1, 2007
69.0 mln
-47.0 mln
-40.52%
jan 1, 2008
113.0 mln
+44.0 mln
63.77%
jan 1, 2009
212.0 mln
+99.0 mln
87.61%
jan 1, 2010
369.0 mln
+157.0 mln
74.06%
jan 1, 2011
379.0 mln
+10.0 mln
2.71%
jan 1, 2012
702.0 mln
+323.0 mln
85.22%
jan 1, 2013
599.0 mln
-103.0 mln
-14.67%
jan 1, 2014
420.0 mln
-179.0 mln
-29.88%
Ranking of countries by current statistics by years


Comments: