29
/
en
AIzaSyAYiBZKx7MnpbEhh9jyipgxe19OcubqV5w
April 1, 2024
178899
Liberia
LBR
true
2
1
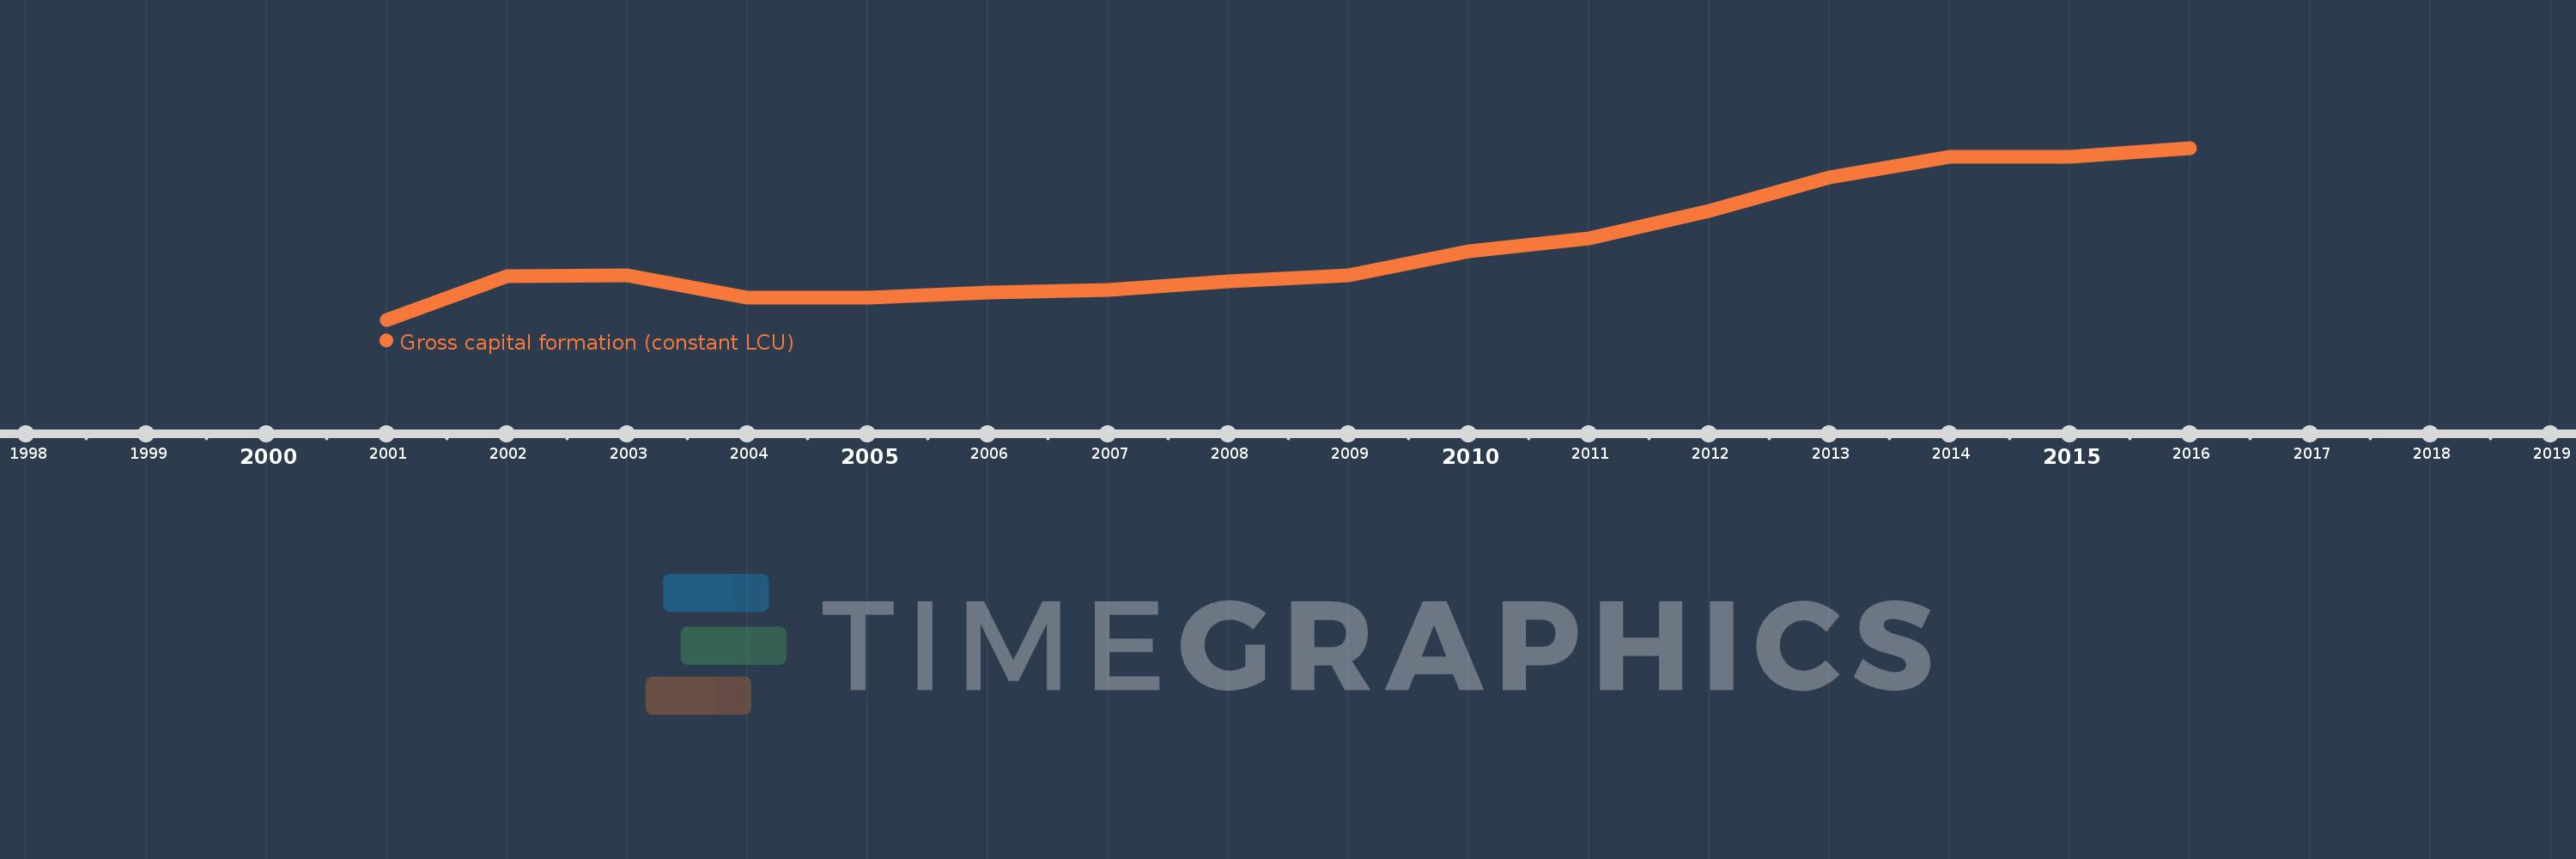
Gross capital formation (constant LCU)
2016,2015,2014,2013,2012,2011,2010,2009,2008,2007,2006,2005,2004,2003,2002,2001
This statistics in other country:
AlbaniaAlgeriaAngolaAntigua and BarbudaArgentinaArmeniaAustraliaAustriaAzerbaijanBahamas, TheBahrainBangladeshBarbadosBelarusBelgiumBelizeBeninBhutanBoliviaBosnia and HerzegovinaBotswanaBrazilBrunei DarussalamBulgariaBurkina FasoBurundiCabo VerdeCambodiaCameroonCanadaChadChileChinaColombiaComorosCongo, Dem. Rep.Congo, Rep.Costa RicaCote d'IvoireCroatiaCubaCyprusCzech RepublicDenmarkDjiboutiDominican RepublicEcuadorEgypt, Arab Rep.El SalvadorEquatorial GuineaEritreaEstoniaEthiopiaFijiFinlandFranceGabonGambia, TheGeorgiaGermanyGhanaGreeceGuatemalaGuineaGuinea-BissauHaitiHondurasHong Kong SAR, ChinaHungaryIcelandIndiaIndonesiaIran, Islamic Rep.IrelandIsraelItalyJamaicaJapanJordanKazakhstanKenyaKorea, Rep.KosovoKuwaitKyrgyz RepublicLao PDRLatviaLebanonLiberiaLithuaniaLuxembourgMacao SAR, ChinaMacedonia, FYRMadagascarMalawiMalaysiaMaliMaltaMauritaniaMauritiusMexicoMoldovaMongoliaMontenegroMoroccoMozambiqueNamibiaNepalNetherlandsNew ZealandNicaraguaNigerNigeriaNorwayOmanPakistanPanamaPapua New GuineaParaguayPeruPhilippinesPolandPortugalPuerto RicoQatarRomaniaRussian FederationRwandaSaudi ArabiaSenegalSerbiaSeychellesSierra LeoneSingaporeSlovak RepublicSloveniaSomaliaSouth AfricaSouth SudanSpainSri LankaSudanSurinameSwazilandSwedenSwitzerlandSyrian Arab RepublicTajikistanTanzaniaThailandTimor-LesteTogoTrinidad and TobagoTunisiaTurkeyTurkmenistanUgandaUkraineUnited Arab EmiratesUnited KingdomUnited StatesUruguayUzbekistanVanuatuVenezuela, RBVietnamWest Bank and GazaZambiaZimbabwe Timeline:
This timeline shows a graph from 2001 to 2016 of Liberia. No data until 2000. Number of actual observations by date: 16.
Source name:
World Development Indicators
Source organization:
World Bank national accounts data, and OECD National Accounts data files.
Categories, topics:
Economy & Growth
Last updated:
apr 23, 2017
Indicators value changes by year
Minimum:
39.68 mln
jan 1, 2001
Maximum:
366.0 mln
jan 1, 2016
At the date of observation
Value
Absolute change
Change from previous value
jan 1, 2001
39.68 mln
+39.68 mln
0.0%
jan 1, 2002
122.522 mln
+82.843 mln
208.78%
jan 1, 2003
123.564 mln
+1.041 mln
0.85%
jan 1, 2004
81.381 mln
-42.182 mln
-34.14%
jan 1, 2005
82.386 mln
+1.005 mln
1.24%
jan 1, 2006
92.089 mln
+9.703 mln
11.78%
jan 1, 2007
96.693 mln
+4.604 mln
5.0%
jan 1, 2008
111.997 mln
+15.304 mln
15.83%
jan 1, 2009
123.993 mln
+11.995 mln
10.71%
jan 1, 2010
169.513 mln
+45.52 mln
36.71%
jan 1, 2011
194.3 mln
+24.787 mln
14.62%
jan 1, 2012
246.735 mln
+52.435 mln
26.99%
jan 1, 2013
309.284 mln
+62.55 mln
25.35%
jan 1, 2014
349.002 mln
+39.718 mln
12.84%
jan 1, 2015
349.926 mln
+924.3K
0.26%
jan 1, 2016
366.0 mln
+16.074 mln
4.59%
Ranking of countries by current statistics by years


Comments: