29
/
en
AIzaSyAYiBZKx7MnpbEhh9jyipgxe19OcubqV5w
April 1, 2024
211751
Niger
NER
true
2
1
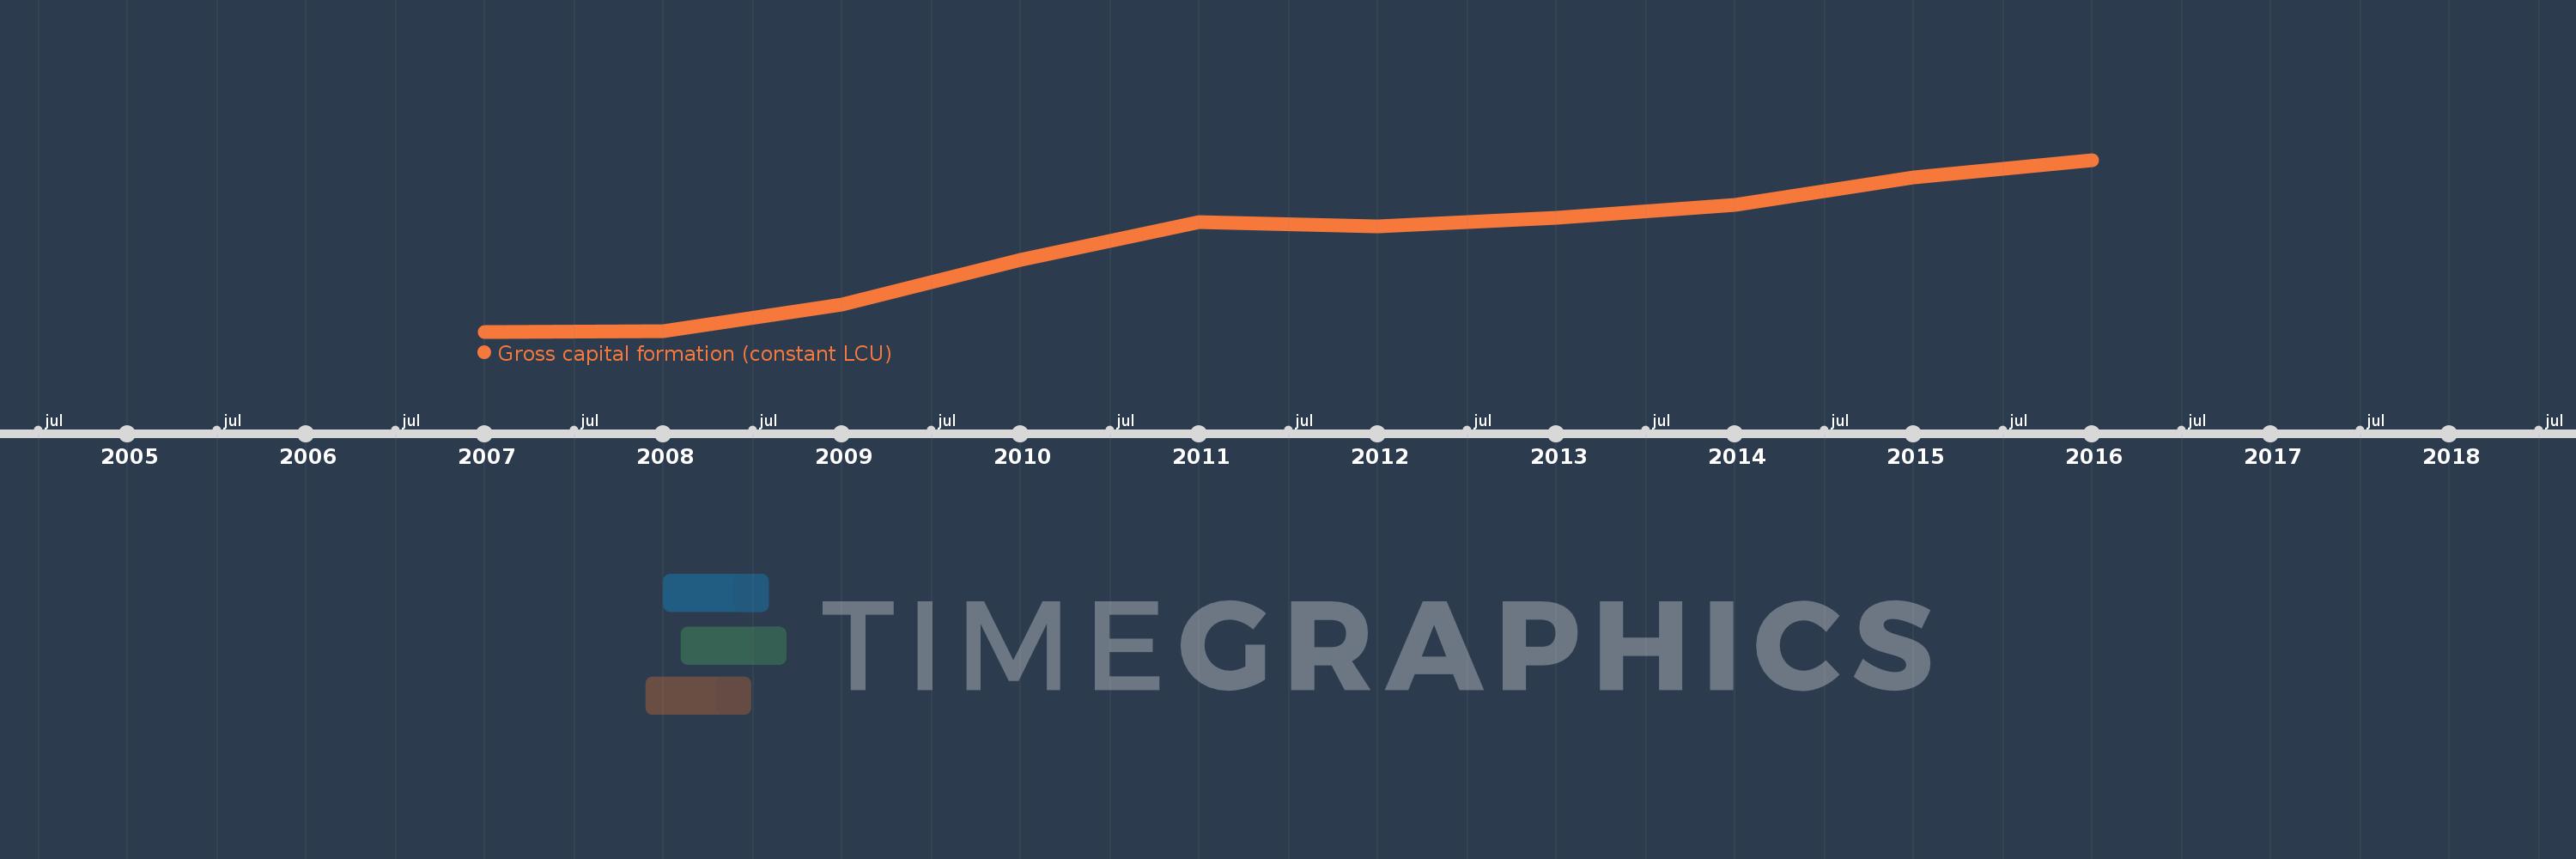
Gross capital formation (constant LCU)
2016,2015,2014,2013,2012,2011,2010,2009,2008,2007
This statistics in other country:
AlbaniaAlgeriaAngolaAntigua and BarbudaArgentinaArmeniaAustraliaAustriaAzerbaijanBahamas, TheBahrainBangladeshBarbadosBelarusBelgiumBelizeBeninBhutanBoliviaBosnia and HerzegovinaBotswanaBrazilBrunei DarussalamBulgariaBurkina FasoBurundiCabo VerdeCambodiaCameroonCanadaChadChileChinaColombiaComorosCongo, Dem. Rep.Congo, Rep.Costa RicaCote d'IvoireCroatiaCubaCyprusCzech RepublicDenmarkDjiboutiDominican RepublicEcuadorEgypt, Arab Rep.El SalvadorEquatorial GuineaEritreaEstoniaEthiopiaFijiFinlandFranceGabonGambia, TheGeorgiaGermanyGhanaGreeceGuatemalaGuineaGuinea-BissauHaitiHondurasHong Kong SAR, ChinaHungaryIcelandIndiaIndonesiaIran, Islamic Rep.IrelandIsraelItalyJamaicaJapanJordanKazakhstanKenyaKorea, Rep.KosovoKuwaitKyrgyz RepublicLao PDRLatviaLebanonLiberiaLithuaniaLuxembourgMacao SAR, ChinaMacedonia, FYRMadagascarMalawiMalaysiaMaliMaltaMauritaniaMauritiusMexicoMoldovaMongoliaMontenegroMoroccoMozambiqueNamibiaNepalNetherlandsNew ZealandNicaraguaNigerNigeriaNorwayOmanPakistanPanamaPapua New GuineaParaguayPeruPhilippinesPolandPortugalPuerto RicoQatarRomaniaRussian FederationRwandaSaudi ArabiaSenegalSerbiaSeychellesSierra LeoneSingaporeSlovak RepublicSloveniaSomaliaSouth AfricaSouth SudanSpainSri LankaSudanSurinameSwazilandSwedenSwitzerlandSyrian Arab RepublicTajikistanTanzaniaThailandTimor-LesteTogoTrinidad and TobagoTunisiaTurkeyTurkmenistanUgandaUkraineUnited Arab EmiratesUnited KingdomUnited StatesUruguayUzbekistanVanuatuVenezuela, RBVietnamWest Bank and GazaZambiaZimbabwe Timeline:
This timeline shows a graph from 2007 to 2016 of Niger. No data until 2006. Number of actual observations by date: 10.
Source name:
World Development Indicators
Source organization:
World Bank national accounts data, and OECD National Accounts data files.
Categories, topics:
Economy & Growth
Last updated:
apr 23, 2017
Indicators value changes by year
Minimum:
449.701 bln
jan 1, 2007
Maximum:
1.128 trl
jan 1, 2016
At the date of observation
Value
Absolute change
Change from previous value
jan 1, 2007
449.701 bln
+449.701 bln
0.0%
jan 1, 2008
449.82 bln
+118.561 mln
0.03%
jan 1, 2009
556.818 bln
+106.998 bln
23.79%
jan 1, 2010
733.508 bln
+176.69 bln
31.73%
jan 1, 2011
880.68 bln
+147.172 bln
20.06%
jan 1, 2012
864.892 bln
-15.788 bln
-1.79%
jan 1, 2013
898.624 bln
+33.732 bln
3.9%
jan 1, 2014
950.679 bln
+52.055 bln
5.79%
jan 1, 2015
1.059 trl
+108.287 bln
11.39%
jan 1, 2016
1.128 trl
+68.903 bln
6.51%
Ranking of countries by current statistics by years


Comments: