29
/
en
AIzaSyAYiBZKx7MnpbEhh9jyipgxe19OcubqV5w
April 1, 2024
109716
Congo, Dem. Rep.
COD
true
2
1
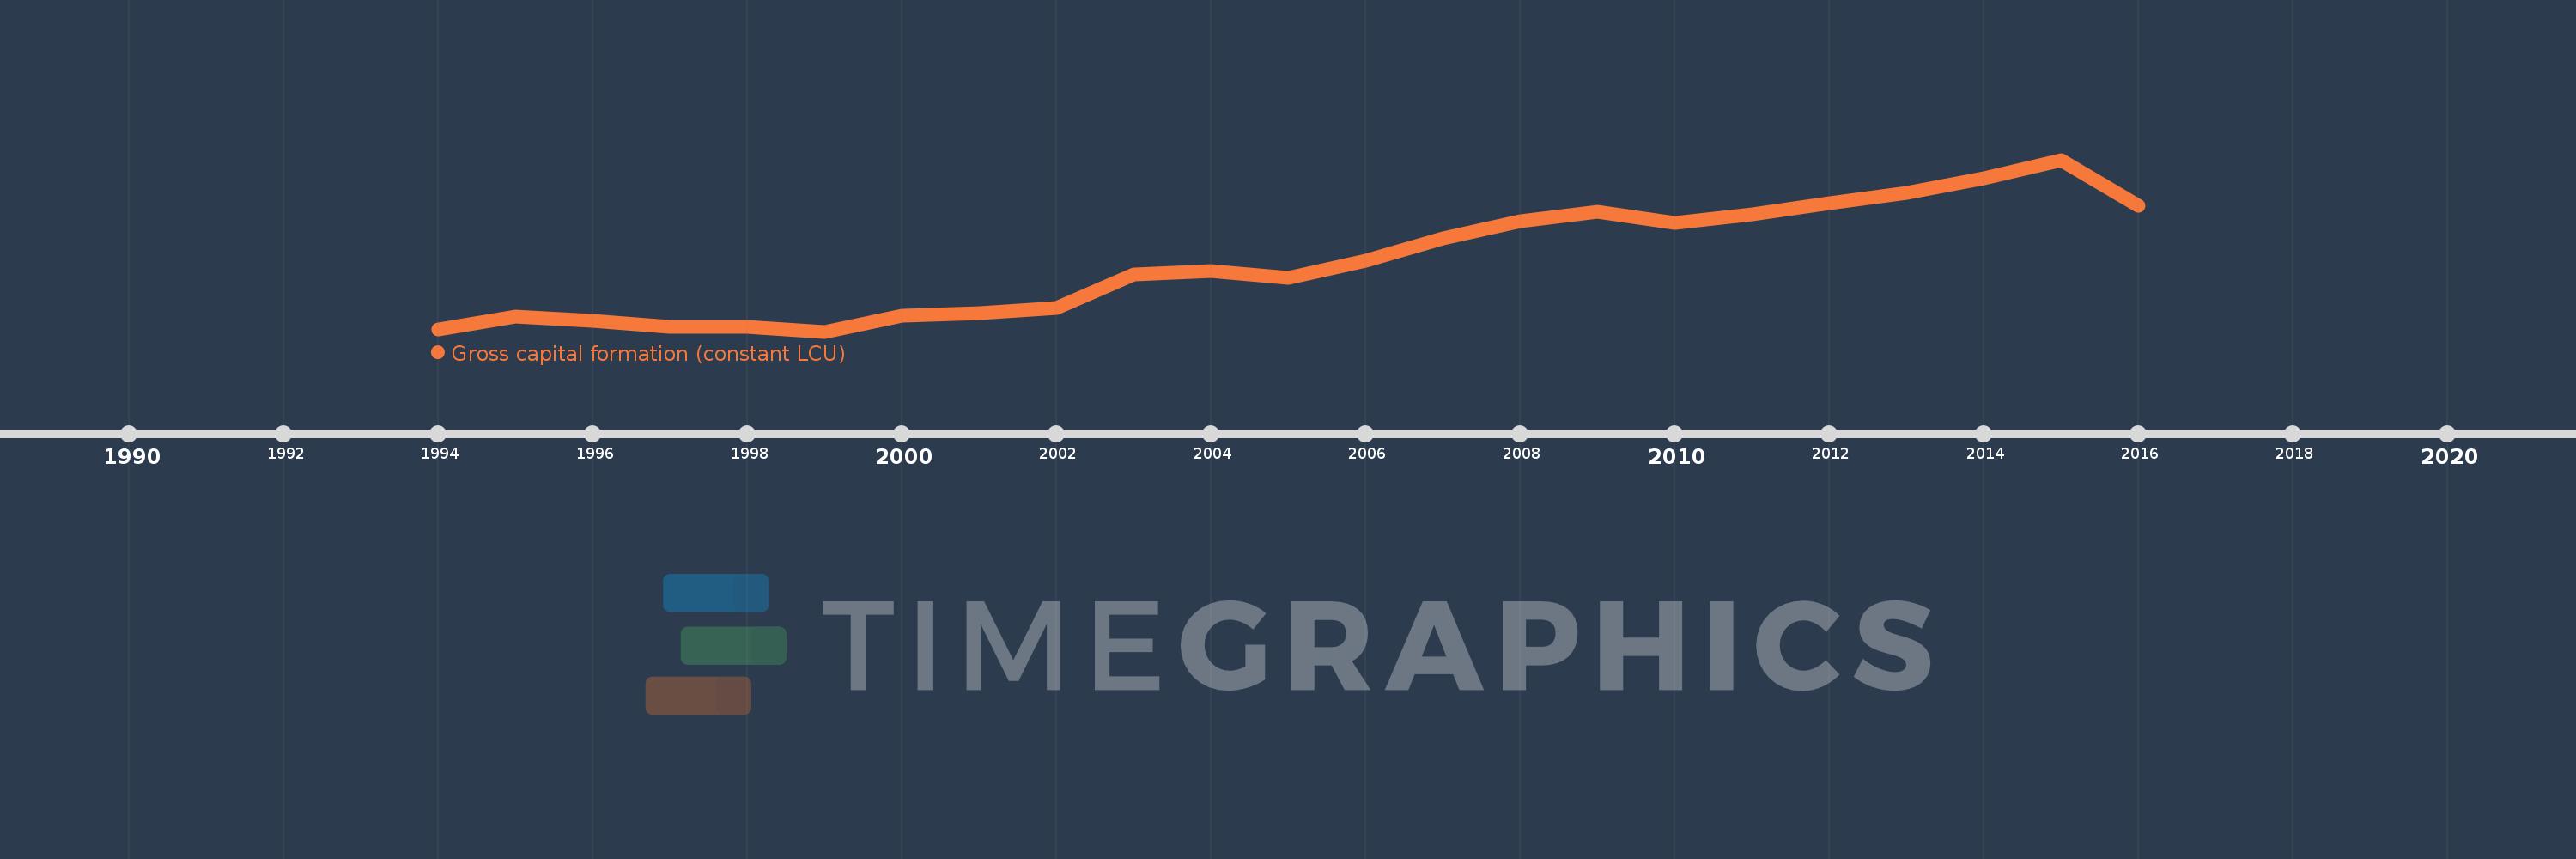
Gross capital formation (constant LCU)
2016,2015,2014,2013,2012,2011,2010,2009,2008,2007,2006,2005,2004,2003,2002,2001,2000,1999,1998,1997,1996,1995,1994
This statistics in other country:
AlbaniaAlgeriaAngolaAntigua and BarbudaArgentinaArmeniaAustraliaAustriaAzerbaijanBahamas, TheBahrainBangladeshBarbadosBelarusBelgiumBelizeBeninBhutanBoliviaBosnia and HerzegovinaBotswanaBrazilBrunei DarussalamBulgariaBurkina FasoBurundiCabo VerdeCambodiaCameroonCanadaChadChileChinaColombiaComorosCongo, Dem. Rep.Congo, Rep.Costa RicaCote d'IvoireCroatiaCubaCyprusCzech RepublicDenmarkDjiboutiDominican RepublicEcuadorEgypt, Arab Rep.El SalvadorEquatorial GuineaEritreaEstoniaEthiopiaFijiFinlandFranceGabonGambia, TheGeorgiaGermanyGhanaGreeceGuatemalaGuineaGuinea-BissauHaitiHondurasHong Kong SAR, ChinaHungaryIcelandIndiaIndonesiaIran, Islamic Rep.IrelandIsraelItalyJamaicaJapanJordanKazakhstanKenyaKorea, Rep.KosovoKuwaitKyrgyz RepublicLao PDRLatviaLebanonLiberiaLithuaniaLuxembourgMacao SAR, ChinaMacedonia, FYRMadagascarMalawiMalaysiaMaliMaltaMauritaniaMauritiusMexicoMoldovaMongoliaMontenegroMoroccoMozambiqueNamibiaNepalNetherlandsNew ZealandNicaraguaNigerNigeriaNorwayOmanPakistanPanamaPapua New GuineaParaguayPeruPhilippinesPolandPortugalPuerto RicoQatarRomaniaRussian FederationRwandaSaudi ArabiaSenegalSerbiaSeychellesSierra LeoneSingaporeSlovak RepublicSloveniaSomaliaSouth AfricaSouth SudanSpainSri LankaSudanSurinameSwazilandSwedenSwitzerlandSyrian Arab RepublicTajikistanTanzaniaThailandTimor-LesteTogoTrinidad and TobagoTunisiaTurkeyTurkmenistanUgandaUkraineUnited Arab EmiratesUnited KingdomUnited StatesUruguayUzbekistanVanuatuVenezuela, RBVietnamWest Bank and GazaZambiaZimbabwe Timeline:
This timeline shows a graph from 1994 to 2016 of Congo, Dem. Rep.. No data until 1993. Number of actual observations by date: 23.
Source name:
World Development Indicators
Source organization:
World Bank national accounts data, and OECD National Accounts data files.
Categories, topics:
Economy & Growth
Last updated:
apr 23, 2017
Indicators value changes by year
Minimum:
267.545 bln
jan 1, 1999
Maximum:
1.239 trl
jan 1, 2015
At the date of observation
Value
Absolute change
Change from previous value
jan 1, 1994
280.965 bln
+280.965 bln
0.0%
jan 1, 1995
350.392 bln
+69.428 bln
24.71%
jan 1, 1996
326.526 bln
-23.866 bln
-6.81%
jan 1, 1997
292.898 bln
-33.629 bln
-10.3%
jan 1, 1998
296.441 bln
+3.543 bln
1.21%
jan 1, 1999
267.545 bln
-28.896 bln
-9.75%
jan 1, 2000
355.099 bln
+87.554 bln
32.73%
jan 1, 2001
372.5 bln
+17.401 bln
4.9%
jan 1, 2002
398.9 bln
+26.4 bln
7.09%
jan 1, 2003
588.6 bln
+189.7 bln
47.56%
jan 1, 2004
610.6 bln
+22.0 bln
3.74%
jan 1, 2005
573.0 bln
-37.6 bln
-6.16%
jan 1, 2006
667.9 bln
+94.9 bln
16.56%
jan 1, 2007
792.66 bln
+124.76 bln
18.68%
jan 1, 2008
889.5 bln
+96.84 bln
12.22%
jan 1, 2009
946.3 bln
+56.8 bln
6.39%
jan 1, 2010
884.0 bln
-62.3 bln
-6.58%
jan 1, 2011
931.806 bln
+47.806 bln
5.41%
jan 1, 2012
991.394 bln
+59.588 bln
6.39%
jan 1, 2013
1.054 trl
+62.672 bln
6.32%
jan 1, 2014
1.137 trl
+82.717 bln
7.85%
jan 1, 2015
1.239 trl
+102.344 bln
9.0%
jan 1, 2016
977.437 bln
-261.691 bln
-21.12%
Ranking of countries by current statistics by years


Comments: