29
/
en
AIzaSyAYiBZKx7MnpbEhh9jyipgxe19OcubqV5w
April 1, 2024
65916
Algeria
DZA
true
2
1
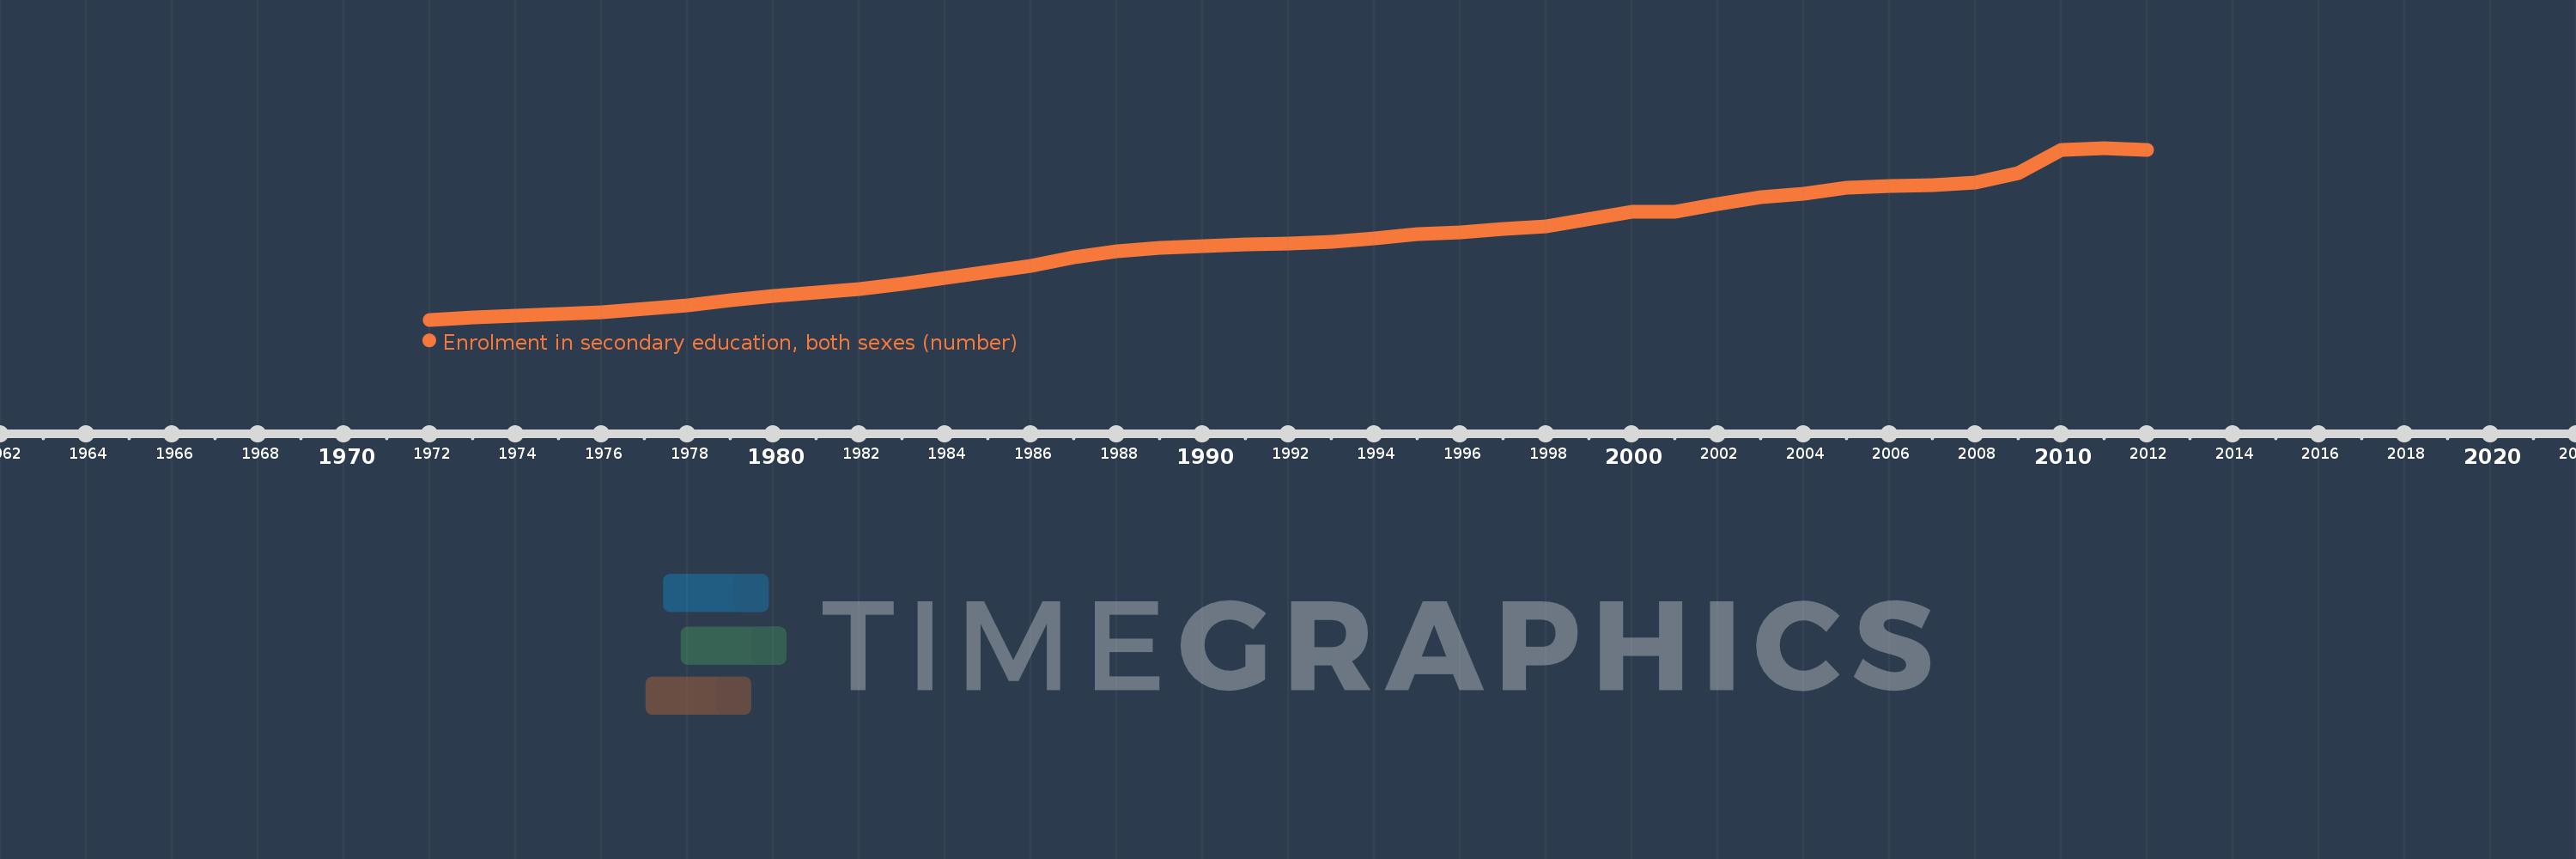
Enrolment in secondary education, both sexes (number)
2012,2011,2010,2009,2008,2007,2006,2005,2004,2003,2002,2001,2000,1998,1997,1996,1995,1994,1993,1992,1991,1990,1989,1988,1987,1986,1985,1984,1983,1982,1981,1980,1979,1978,1977,1976,1975,1974,1973,1972
This statistics in other country:
AfghanistanAlbaniaAlgeriaAmerican SamoaAndorraAngolaAntigua and BarbudaArab WorldArgentinaArmeniaArubaAustraliaAustriaAzerbaijanBahamas, TheBahrainBangladeshBarbadosBelarusBelgiumBelizeBeninBermudaBhutanBoliviaBosnia and HerzegovinaBotswanaBrazilBritish Virgin IslandsBrunei DarussalamBulgariaBurkina FasoBurundiCabo VerdeCambodiaCameroonCanadaCaribbean small statesCayman IslandsCentral African RepublicCentral Europe and the BalticsChadChileChinaColombiaComorosCongo, Dem. Rep.Congo, Rep.Costa RicaCote d'IvoireCroatiaCubaCuracaoCyprusCzech RepublicDenmarkDjiboutiDominicaDominican RepublicEarly-demographic dividendEast Asia & PacificEast Asia & Pacific (excluding high income)East Asia & Pacific (IDA & IBRD countries)EcuadorEgypt, Arab Rep.El SalvadorEquatorial GuineaEritreaEstoniaEthiopiaEuro areaEurope & Central AsiaEurope & Central Asia (excluding high income)Europe & Central Asia (IDA & IBRD countries)European UnionFaroe IslandsFijiFinlandFragile and conflict affected situationsFranceFrench PolynesiaGabonGambia, TheGeorgiaGermanyGhanaGibraltarGreeceGrenadaGuamGuatemalaGuineaGuinea-BissauGuyanaHaitiHeavily indebted poor countries (HIPC)High incomeHondurasHong Kong SAR, ChinaHungaryIBRD onlyIcelandIDA & IBRD totalIDA blendIDA onlyIDA totalIndiaIndonesiaIran, Islamic Rep.IraqIrelandIsraelItalyJamaicaJapanJordanKazakhstanKenyaKiribatiKorea, Dem. People’s Rep.Korea, Rep.KuwaitKyrgyz RepublicLao PDRLate-demographic dividendLatin America & Caribbean Latin America & Caribbean (excluding high income)Latin America & the Caribbean (IDA & IBRD countries)LatviaLeast developed countries: UN classificationLebanonLesothoLiberiaLibyaLiechtensteinLithuaniaLow & middle incomeLow incomeLower middle incomeLuxembourgMacao SAR, ChinaMacedonia, FYRMadagascarMalawiMalaysiaMaldivesMaliMaltaMarshall IslandsMauritaniaMauritiusMexicoMicronesia, Fed. Sts.Middle East & North AfricaMiddle East & North Africa (excluding high income)Middle East & North Africa (IDA & IBRD countries)Middle incomeMoldovaMonacoMongoliaMontenegroMoroccoMozambiqueMyanmarNamibiaNauruNepalNetherlandsNew CaledoniaNew ZealandNicaraguaNigerNigeriaNorth AmericaNorwayOECD membersOmanOther small statesPacific island small statesPakistanPalauPanamaPapua New GuineaParaguayPeruPhilippinesPolandPortugalPost-demographic dividendPre-demographic dividendPuerto RicoQatarRomaniaRussian FederationRwandaSamoaSan MarinoSao Tome and PrincipeSaudi ArabiaSenegalSerbiaSeychellesSierra LeoneSingaporeSint Maarten (Dutch part)Slovak RepublicSloveniaSmall statesSolomon IslandsSomaliaSouth AfricaSouth AsiaSouth Asia (IDA & IBRD)SpainSri LankaSt. Kitts and NevisSt. LuciaSt. Vincent and the GrenadinesSub-Saharan Africa Sub-Saharan Africa (excluding high income)Sub-Saharan Africa (IDA & IBRD countries)SudanSurinameSwazilandSwedenSwitzerlandSyrian Arab RepublicTajikistanTanzaniaThailandTimor-LesteTogoTongaTrinidad and TobagoTunisiaTurkeyTurkmenistanTurks and Caicos IslandsTuvaluUgandaUkraineUnited Arab EmiratesUnited KingdomUnited StatesUpper middle incomeUruguayUzbekistanVanuatuVenezuela, RBVietnamVirgin Islands (U.S.)West Bank and GazaWorldYemen, Rep.ZambiaZimbabwe Timeline:
This timeline shows a graph from 1972 to 2012 of Algeria. No data until 1971. Number of actual observations by date: 40.
Source name:
World Development Indicators
Source organization:
UNESCO Institute for Statistics
Categories, topics:
Education
Last updated:
apr 23, 2017
Indicators value changes by year
Minimum:
242.335K
jan 1, 1972
Maximum:
4.616 mln
jan 1, 2011
At the date of observation
Value
Absolute change
Change from previous value
jan 1, 1972
242.335K
+242.335K
0.0%
jan 1, 1973
299.28K
+56.945K
23.5%
jan 1, 1974
343.393K
+44.113K
14.74%
jan 1, 1975
384.001K
+40.608K
11.83%
jan 1, 1976
429.684K
+45.683K
11.9%
jan 1, 1977
509.258K
+79.574K
18.52%
jan 1, 1978
612.229K
+102.971K
20.22%
jan 1, 1979
741.961K
+129.732K
21.19%
jan 1, 1980
844.291K
+102.33K
13.79%
jan 1, 1981
933.335K
+89.044K
10.55%
jan 1, 1982
1.028 mln
+94.959K
10.17%
jan 1, 1983
1.155 mln
+126.415K
12.29%
jan 1, 1984
1.297 mln
+142.781K
12.37%
jan 1, 1985
1.452 mln
+154.899K
11.94%
jan 1, 1986
1.612 mln
+159.355K
10.97%
jan 1, 1987
1.823 mln
+211.648K
13.13%
jan 1, 1988
1.976 mln
+152.461K
8.36%
jan 1, 1989
2.083 mln
+106.793K
5.4%
jan 1, 1990
2.111 mln
+28.646K
1.38%
jan 1, 1991
2.162 mln
+51.177K
2.42%
jan 1, 1992
2.176 mln
+13.111K
0.61%
jan 1, 1993
2.233 mln
+57.2K
2.63%
jan 1, 1994
2.305 mln
+72.418K
3.24%
jan 1, 1995
2.412 mln
+106.881K
4.64%
jan 1, 1996
2.473 mln
+60.49K
2.51%
jan 1, 1997
2.545 mln
+72.295K
2.92%
jan 1, 1998
2.618 mln
+73.378K
2.88%
jan 1, 2000
2.985 mln
+366.685K
14.01%
jan 1, 2001
2.994 mln
+9.331K
0.31%
jan 1, 2002
3.189 mln
+194.568K
6.5%
jan 1, 2003
3.352 mln
+163.514K
5.13%
jan 1, 2004
3.456 mln
+103.59K
3.09%
jan 1, 2005
3.605 mln
+148.855K
4.31%
jan 1, 2006
3.654 mln
+49.447K
1.37%
jan 1, 2007
3.665 mln
+10.62K
0.29%
jan 1, 2008
3.724 mln
+59.243K
1.62%
jan 1, 2009
3.985 mln
+260.441K
6.99%
jan 1, 2010
4.576 mln
+591.63K
14.85%
jan 1, 2011
4.616 mln
+40.06K
0.88%
jan 1, 2012
4.573 mln
-43.713K
-0.95%
Ranking of countries by current statistics by years


Comments: