29
/
en
AIzaSyAYiBZKx7MnpbEhh9jyipgxe19OcubqV5w
April 1, 2024
34181
Fragile and conflict affected situations
FCS
false
2
1
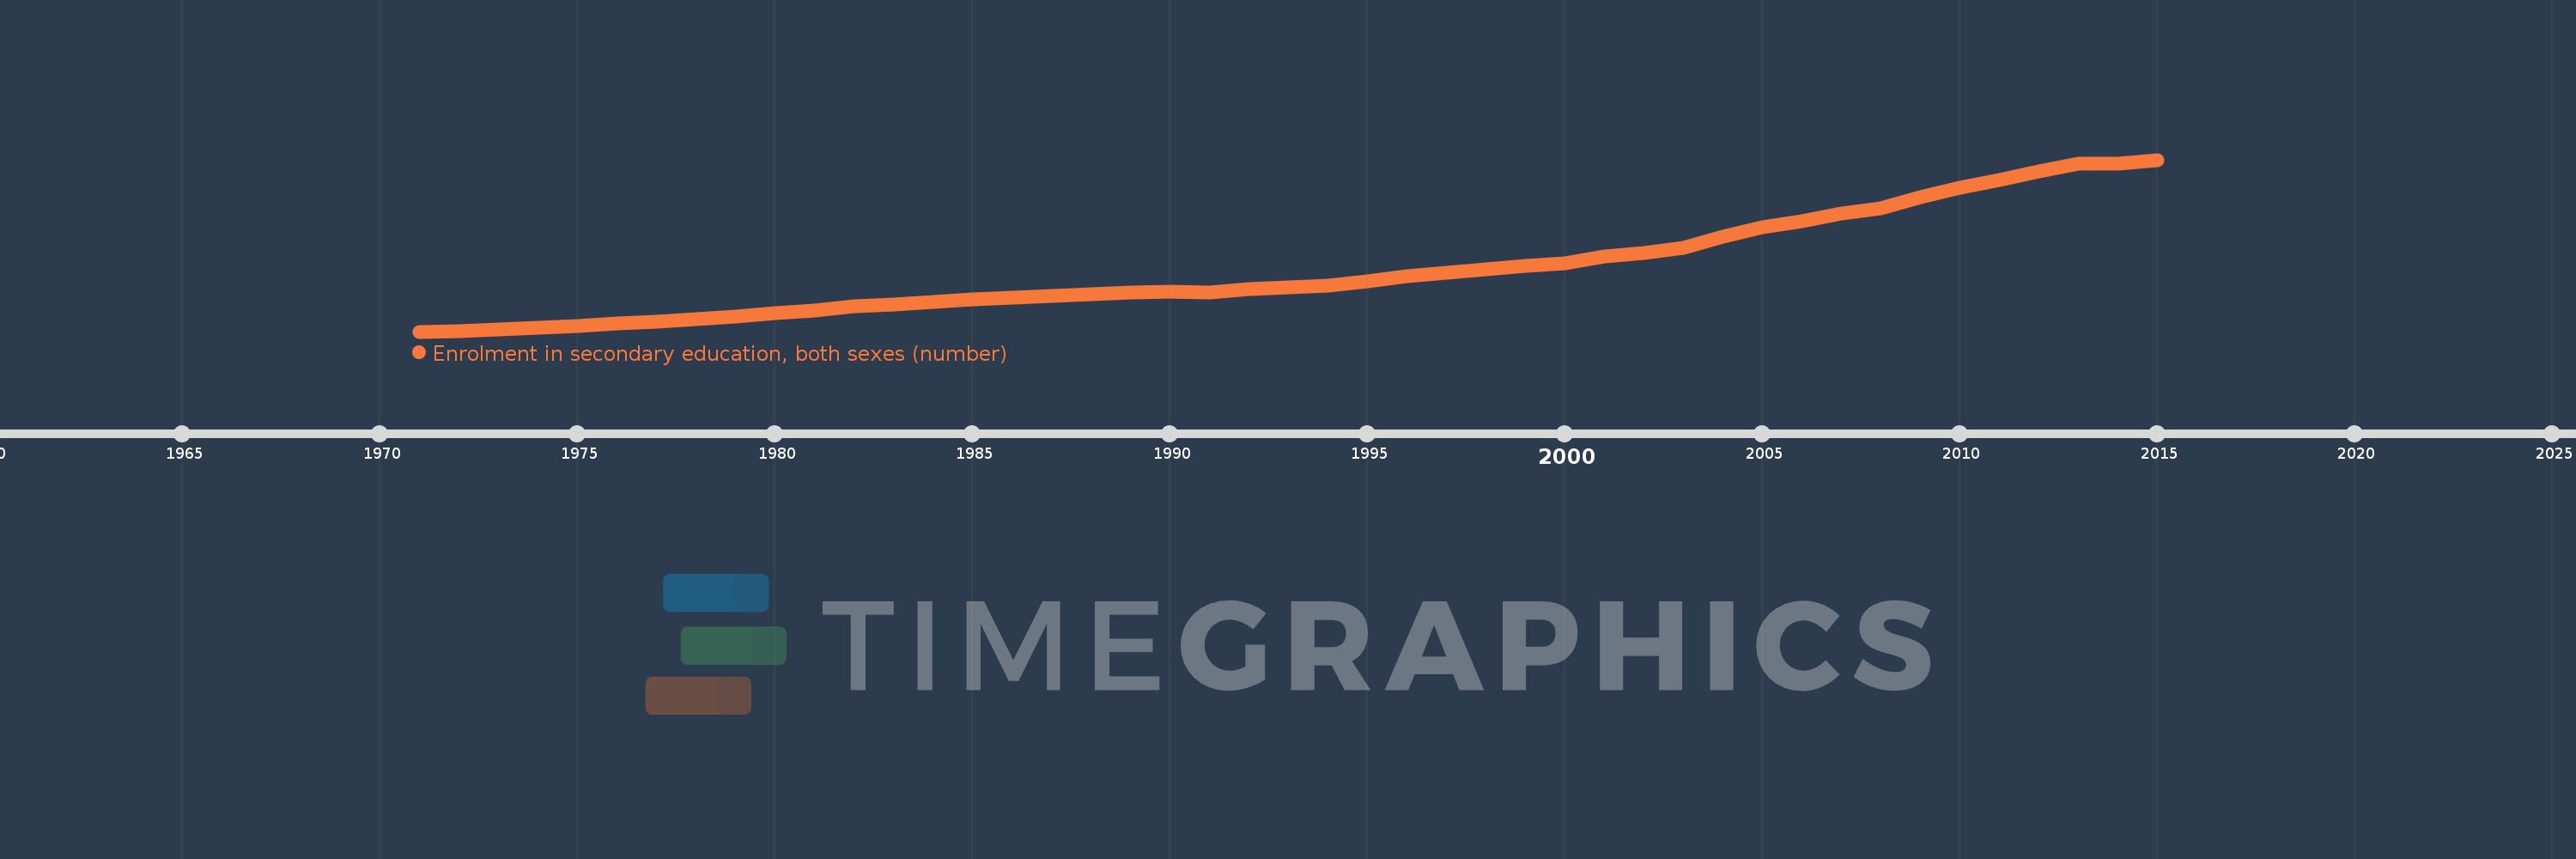
Enrolment in secondary education, both sexes (number)
2015,2014,2013,2012,2011,2010,2009,2008,2007,2006,2005,2004,2003,2002,2001,2000,1999,1998,1997,1996,1995,1994,1993,1992,1991,1990,1989,1988,1987,1986,1985,1984,1983,1982,1981,1980,1979,1978,1977,1976,1975,1974,1973,1972,1971
This statistics in other country:
AfghanistanAlbaniaAlgeriaAmerican SamoaAndorraAngolaAntigua and BarbudaArab WorldArgentinaArmeniaArubaAustraliaAustriaAzerbaijanBahamas, TheBahrainBangladeshBarbadosBelarusBelgiumBelizeBeninBermudaBhutanBoliviaBosnia and HerzegovinaBotswanaBrazilBritish Virgin IslandsBrunei DarussalamBulgariaBurkina FasoBurundiCabo VerdeCambodiaCameroonCanadaCaribbean small statesCayman IslandsCentral African RepublicCentral Europe and the BalticsChadChileChinaColombiaComorosCongo, Dem. Rep.Congo, Rep.Costa RicaCote d'IvoireCroatiaCubaCuracaoCyprusCzech RepublicDenmarkDjiboutiDominicaDominican RepublicEarly-demographic dividendEast Asia & PacificEast Asia & Pacific (excluding high income)East Asia & Pacific (IDA & IBRD countries)EcuadorEgypt, Arab Rep.El SalvadorEquatorial GuineaEritreaEstoniaEthiopiaEuro areaEurope & Central AsiaEurope & Central Asia (excluding high income)Europe & Central Asia (IDA & IBRD countries)European UnionFaroe IslandsFijiFinlandFragile and conflict affected situationsFranceFrench PolynesiaGabonGambia, TheGeorgiaGermanyGhanaGibraltarGreeceGrenadaGuamGuatemalaGuineaGuinea-BissauGuyanaHaitiHeavily indebted poor countries (HIPC)High incomeHondurasHong Kong SAR, ChinaHungaryIBRD onlyIcelandIDA & IBRD totalIDA blendIDA onlyIDA totalIndiaIndonesiaIran, Islamic Rep.IraqIrelandIsraelItalyJamaicaJapanJordanKazakhstanKenyaKiribatiKorea, Dem. People’s Rep.Korea, Rep.KuwaitKyrgyz RepublicLao PDRLate-demographic dividendLatin America & Caribbean Latin America & Caribbean (excluding high income)Latin America & the Caribbean (IDA & IBRD countries)LatviaLeast developed countries: UN classificationLebanonLesothoLiberiaLibyaLiechtensteinLithuaniaLow & middle incomeLow incomeLower middle incomeLuxembourgMacao SAR, ChinaMacedonia, FYRMadagascarMalawiMalaysiaMaldivesMaliMaltaMarshall IslandsMauritaniaMauritiusMexicoMicronesia, Fed. Sts.Middle East & North AfricaMiddle East & North Africa (excluding high income)Middle East & North Africa (IDA & IBRD countries)Middle incomeMoldovaMonacoMongoliaMontenegroMoroccoMozambiqueMyanmarNamibiaNauruNepalNetherlandsNew CaledoniaNew ZealandNicaraguaNigerNigeriaNorth AmericaNorwayOECD membersOmanOther small statesPacific island small statesPakistanPalauPanamaPapua New GuineaParaguayPeruPhilippinesPolandPortugalPost-demographic dividendPre-demographic dividendPuerto RicoQatarRomaniaRussian FederationRwandaSamoaSan MarinoSao Tome and PrincipeSaudi ArabiaSenegalSerbiaSeychellesSierra LeoneSingaporeSint Maarten (Dutch part)Slovak RepublicSloveniaSmall statesSolomon IslandsSomaliaSouth AfricaSouth AsiaSouth Asia (IDA & IBRD)SpainSri LankaSt. Kitts and NevisSt. LuciaSt. Vincent and the GrenadinesSub-Saharan Africa Sub-Saharan Africa (excluding high income)Sub-Saharan Africa (IDA & IBRD countries)SudanSurinameSwazilandSwedenSwitzerlandSyrian Arab RepublicTajikistanTanzaniaThailandTimor-LesteTogoTongaTrinidad and TobagoTunisiaTurkeyTurkmenistanTurks and Caicos IslandsTuvaluUgandaUkraineUnited Arab EmiratesUnited KingdomUnited StatesUpper middle incomeUruguayUzbekistanVanuatuVenezuela, RBVietnamVirgin Islands (U.S.)West Bank and GazaWorldYemen, Rep.ZambiaZimbabwe Timeline:
This timeline shows a graph from 1971 to 2015 of Fragile and conflict affected situations. No data until 1970. Number of actual observations by date: 45.
Source name:
World Development Indicators
Source organization:
UNESCO Institute for Statistics
Categories, topics:
Education
Last updated:
apr 23, 2017
Indicators value changes by year
Minimum:
4.129 mln
jan 1, 1971
Maximum:
29.457 mln
jan 1, 2015
At the date of observation
Value
Absolute change
Change from previous value
jan 1, 1971
4.129 mln
+4.129 mln
0.0%
jan 1, 1972
4.222 mln
+93.247K
2.26%
jan 1, 1973
4.449 mln
+226.562K
5.37%
jan 1, 1974
4.706 mln
+257.478K
5.79%
jan 1, 1975
4.924 mln
+217.79K
4.63%
jan 1, 1976
5.299 mln
+374.721K
7.61%
jan 1, 1977
5.628 mln
+329.32K
6.22%
jan 1, 1978
5.914 mln
+285.738K
5.08%
jan 1, 1979
6.335 mln
+421.771K
7.13%
jan 1, 1980
6.884 mln
+548.25K
8.65%
jan 1, 1981
7.283 mln
+399.24K
5.8%
jan 1, 1982
7.834 mln
+551.37K
7.57%
jan 1, 1983
8.167 mln
+332.949K
4.25%
jan 1, 1984
8.514 mln
+346.639K
4.24%
jan 1, 1985
8.906 mln
+392.249K
4.61%
jan 1, 1986
9.164 mln
+258.119K
2.9%
jan 1, 1987
9.391 mln
+226.979K
2.48%
jan 1, 1988
9.626 mln
+234.928K
2.5%
jan 1, 1989
9.848 mln
+222.363K
2.31%
jan 1, 1990
10.055 mln
+206.316K
2.09%
jan 1, 1991
9.883 mln
-172.03K
-1.71%
jan 1, 1992
10.341 mln
+457.99K
4.63%
jan 1, 1993
10.594 mln
+253.289K
2.45%
jan 1, 1994
10.953 mln
+359.006K
3.39%
jan 1, 1995
11.592 mln
+638.728K
5.83%
jan 1, 1996
12.301 mln
+709.437K
6.12%
jan 1, 1997
12.781 mln
+480.14K
3.9%
jan 1, 1998
13.253 mln
+471.485K
3.69%
jan 1, 1999
13.803 mln
+550.587K
4.15%
jan 1, 2000
14.256 mln
+452.778K
3.28%
jan 1, 2001
15.151 mln
+895.086K
6.28%
jan 1, 2002
15.754 mln
+602.305K
3.98%
jan 1, 2003
16.528 mln
+774.109K
4.91%
jan 1, 2004
18.102 mln
+1.575 mln
9.53%
jan 1, 2005
19.509 mln
+1.406 mln
7.77%
jan 1, 2006
20.37 mln
+861.692K
4.42%
jan 1, 2007
21.603 mln
+1.233 mln
6.05%
jan 1, 2008
22.345 mln
+741.572K
3.43%
jan 1, 2009
23.929 mln
+1.585 mln
7.09%
jan 1, 2010
25.286 mln
+1.357 mln
5.67%
jan 1, 2011
26.464 mln
+1.178 mln
4.66%
jan 1, 2012
27.776 mln
+1.312 mln
4.96%
jan 1, 2013
28.902 mln
+1.126 mln
4.05%
jan 1, 2014
28.855 mln
-47.098K
-0.16%
jan 1, 2015
29.457 mln
+602.398K
2.09%
Ranking of countries by current statistics by years


Comments: