29
/
en
AIzaSyAYiBZKx7MnpbEhh9jyipgxe19OcubqV5w
April 1, 2024
64622
Albania
ALB
true
2
1
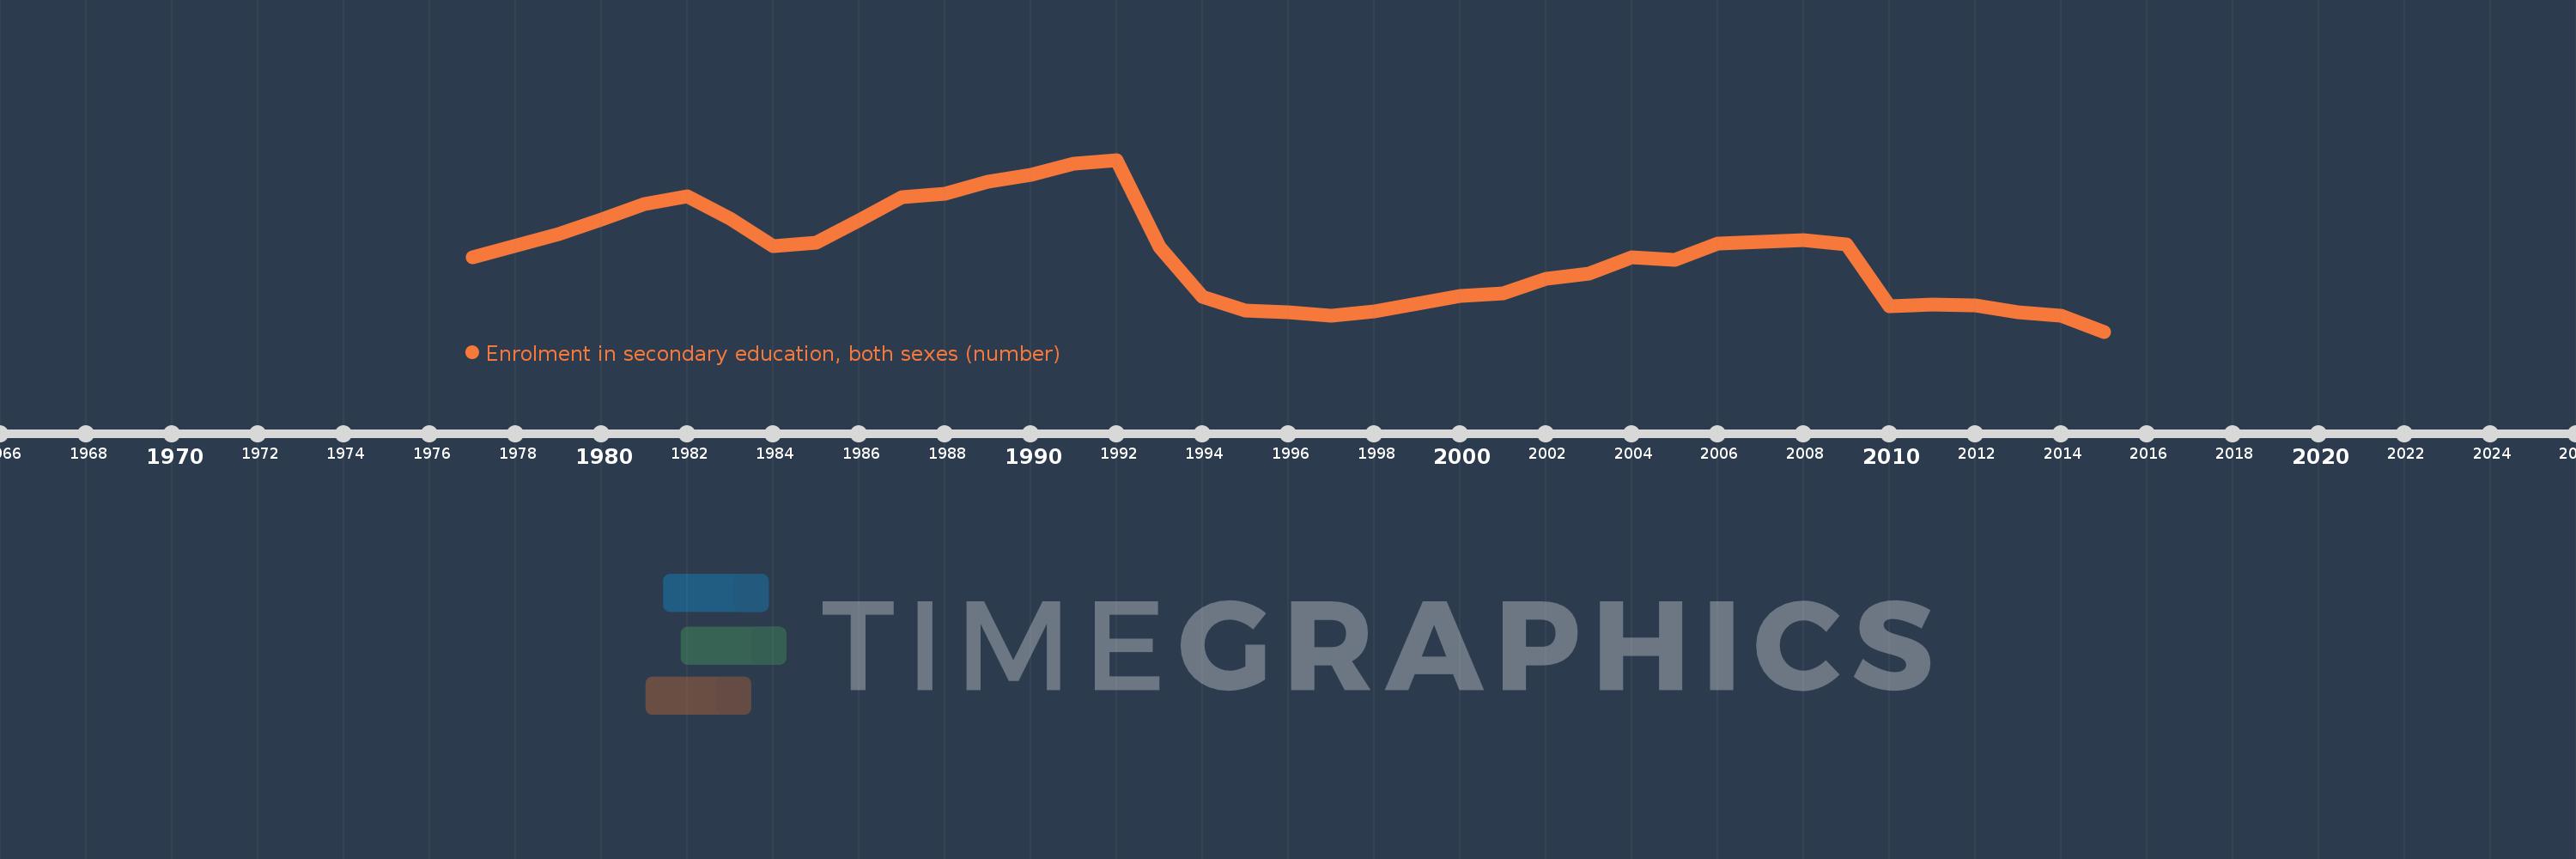
Enrolment in secondary education, both sexes (number)
2015,2014,2013,2012,2011,2010,2009,2008,2007,2006,2005,2004,2003,2002,2001,2000,1998,1997,1996,1995,1994,1993,1992,1991,1990,1989,1988,1987,1986,1985,1984,1983,1982,1981,1980,1979,1977
This statistics in other country:
AfghanistanAlbaniaAlgeriaAmerican SamoaAndorraAngolaAntigua and BarbudaArab WorldArgentinaArmeniaArubaAustraliaAustriaAzerbaijanBahamas, TheBahrainBangladeshBarbadosBelarusBelgiumBelizeBeninBermudaBhutanBoliviaBosnia and HerzegovinaBotswanaBrazilBritish Virgin IslandsBrunei DarussalamBulgariaBurkina FasoBurundiCabo VerdeCambodiaCameroonCanadaCaribbean small statesCayman IslandsCentral African RepublicCentral Europe and the BalticsChadChileChinaColombiaComorosCongo, Dem. Rep.Congo, Rep.Costa RicaCote d'IvoireCroatiaCubaCuracaoCyprusCzech RepublicDenmarkDjiboutiDominicaDominican RepublicEarly-demographic dividendEast Asia & PacificEast Asia & Pacific (excluding high income)East Asia & Pacific (IDA & IBRD countries)EcuadorEgypt, Arab Rep.El SalvadorEquatorial GuineaEritreaEstoniaEthiopiaEuro areaEurope & Central AsiaEurope & Central Asia (excluding high income)Europe & Central Asia (IDA & IBRD countries)European UnionFaroe IslandsFijiFinlandFragile and conflict affected situationsFranceFrench PolynesiaGabonGambia, TheGeorgiaGermanyGhanaGibraltarGreeceGrenadaGuamGuatemalaGuineaGuinea-BissauGuyanaHaitiHeavily indebted poor countries (HIPC)High incomeHondurasHong Kong SAR, ChinaHungaryIBRD onlyIcelandIDA & IBRD totalIDA blendIDA onlyIDA totalIndiaIndonesiaIran, Islamic Rep.IraqIrelandIsraelItalyJamaicaJapanJordanKazakhstanKenyaKiribatiKorea, Dem. People’s Rep.Korea, Rep.KuwaitKyrgyz RepublicLao PDRLate-demographic dividendLatin America & Caribbean Latin America & Caribbean (excluding high income)Latin America & the Caribbean (IDA & IBRD countries)LatviaLeast developed countries: UN classificationLebanonLesothoLiberiaLibyaLiechtensteinLithuaniaLow & middle incomeLow incomeLower middle incomeLuxembourgMacao SAR, ChinaMacedonia, FYRMadagascarMalawiMalaysiaMaldivesMaliMaltaMarshall IslandsMauritaniaMauritiusMexicoMicronesia, Fed. Sts.Middle East & North AfricaMiddle East & North Africa (excluding high income)Middle East & North Africa (IDA & IBRD countries)Middle incomeMoldovaMonacoMongoliaMontenegroMoroccoMozambiqueMyanmarNamibiaNauruNepalNetherlandsNew CaledoniaNew ZealandNicaraguaNigerNigeriaNorth AmericaNorwayOECD membersOmanOther small statesPacific island small statesPakistanPalauPanamaPapua New GuineaParaguayPeruPhilippinesPolandPortugalPost-demographic dividendPre-demographic dividendPuerto RicoQatarRomaniaRussian FederationRwandaSamoaSan MarinoSao Tome and PrincipeSaudi ArabiaSenegalSerbiaSeychellesSierra LeoneSingaporeSint Maarten (Dutch part)Slovak RepublicSloveniaSmall statesSolomon IslandsSomaliaSouth AfricaSouth AsiaSouth Asia (IDA & IBRD)SpainSri LankaSt. Kitts and NevisSt. LuciaSt. Vincent and the GrenadinesSub-Saharan Africa Sub-Saharan Africa (excluding high income)Sub-Saharan Africa (IDA & IBRD countries)SudanSurinameSwazilandSwedenSwitzerlandSyrian Arab RepublicTajikistanTanzaniaThailandTimor-LesteTogoTongaTrinidad and TobagoTunisiaTurkeyTurkmenistanTurks and Caicos IslandsTuvaluUgandaUkraineUnited Arab EmiratesUnited KingdomUnited StatesUpper middle incomeUruguayUzbekistanVanuatuVenezuela, RBVietnamVirgin Islands (U.S.)West Bank and GazaWorldYemen, Rep.ZambiaZimbabwe Timeline:
This timeline shows a graph from 1977 to 2015 of Albania. No data until 1976. Number of actual observations by date: 37.
Source name:
World Development Indicators
Source organization:
UNESCO Institute for Statistics
Categories, topics:
Education
Last updated:
apr 23, 2017
Indicators value changes by year
Minimum:
333.291K
jan 1, 2015
Maximum:
478.285K
jan 1, 1992
At the date of observation
Value
Absolute change
Change from previous value
jan 1, 1977
396.099K
+396.099K
0.0%
jan 1, 1979
415.601K
+19.502K
4.92%
jan 1, 1980
428.218K
+12.617K
3.04%
jan 1, 1981
440.617K
+12.399K
2.9%
jan 1, 1982
447.501K
+6.884K
1.56%
jan 1, 1983
428.75K
-18.751K
-4.19%
jan 1, 1984
405.293K
-23.457K
-5.47%
jan 1, 1985
408.591K
+3.298K
0.81%
jan 1, 1986
426.837K
+18.246K
4.47%
jan 1, 1987
446.794K
+19.957K
4.68%
jan 1, 1988
449.699K
+2.905K
0.65%
jan 1, 1989
459.88K
+10.181K
2.26%
jan 1, 1990
465.958K
+6.078K
1.32%
jan 1, 1991
475.074K
+9.116K
1.96%
jan 1, 1992
478.285K
+3.211K
0.68%
jan 1, 1993
404.904K
-73.381K
-15.34%
jan 1, 1994
362.439K
-42.465K
-10.49%
jan 1, 1995
350.912K
-11.527K
-3.18%
jan 1, 1996
349.43K
-1.482K
-0.42%
jan 1, 1997
346.945K
-2.485K
-0.71%
jan 1, 1998
350.157K
+3.212K
0.93%
jan 1, 2000
363.502K
+13.345K
3.81%
jan 1, 2001
365.664K
+2.162K
0.59%
jan 1, 2002
377.936K
+12.272K
3.36%
jan 1, 2003
382.205K
+4.269K
1.13%
jan 1, 2004
396.095K
+13.89K
3.63%
jan 1, 2005
393.503K
-2.592K
-0.65%
jan 1, 2006
407.403K
+13.9K
3.53%
jan 1, 2007
408.98K
+1.577K
0.39%
jan 1, 2008
410.444K
+1.464K
0.36%
jan 1, 2009
406.553K
-3.891K
-0.95%
jan 1, 2010
354.587K
-51.966K
-12.78%
jan 1, 2011
355.871K
+1.284K
0.36%
jan 1, 2012
355.158K
-713.0
-0.2%
jan 1, 2013
349.269K
-5.889K
-1.66%
jan 1, 2014
346.365K
-2.904K
-0.83%
jan 1, 2015
333.291K
-13.074K
-3.77%
Ranking of countries by current statistics by years


Comments: