29
/
en
AIzaSyAYiBZKx7MnpbEhh9jyipgxe19OcubqV5w
April 1, 2024
262156
Thailand
THA
true
2
1
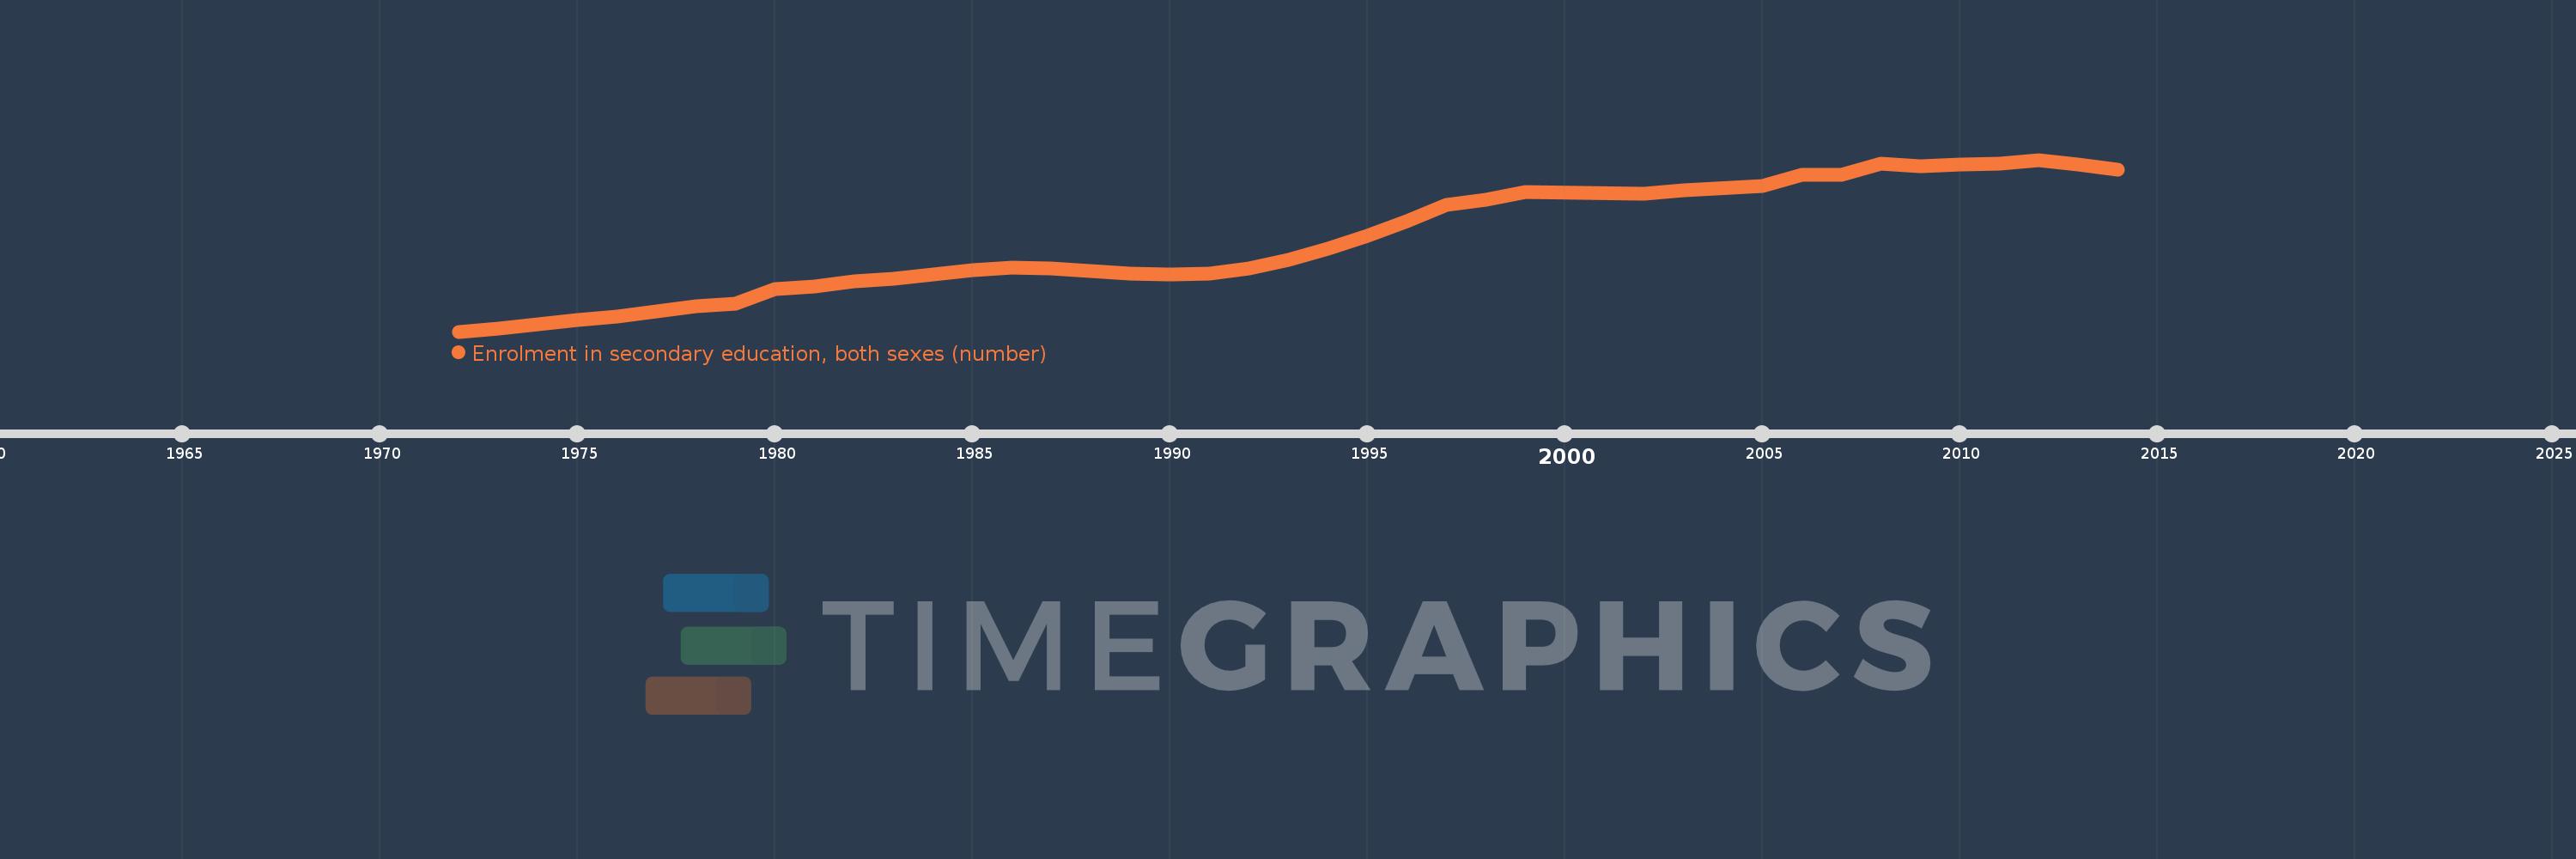
Enrolment in secondary education, both sexes (number)
2014,2013,2012,2011,2010,2009,2008,2007,2006,2005,2003,2002,1999,1998,1997,1996,1995,1994,1993,1992,1991,1990,1989,1988,1987,1986,1985,1983,1982,1981,1980,1979,1978,1977,1976,1975,1974,1973,1972
This statistics in other country:
AfghanistanAlbaniaAlgeriaAmerican SamoaAndorraAngolaAntigua and BarbudaArab WorldArgentinaArmeniaArubaAustraliaAustriaAzerbaijanBahamas, TheBahrainBangladeshBarbadosBelarusBelgiumBelizeBeninBermudaBhutanBoliviaBosnia and HerzegovinaBotswanaBrazilBritish Virgin IslandsBrunei DarussalamBulgariaBurkina FasoBurundiCabo VerdeCambodiaCameroonCanadaCaribbean small statesCayman IslandsCentral African RepublicCentral Europe and the BalticsChadChileChinaColombiaComorosCongo, Dem. Rep.Congo, Rep.Costa RicaCote d'IvoireCroatiaCubaCuracaoCyprusCzech RepublicDenmarkDjiboutiDominicaDominican RepublicEarly-demographic dividendEast Asia & PacificEast Asia & Pacific (excluding high income)East Asia & Pacific (IDA & IBRD countries)EcuadorEgypt, Arab Rep.El SalvadorEquatorial GuineaEritreaEstoniaEthiopiaEuro areaEurope & Central AsiaEurope & Central Asia (excluding high income)Europe & Central Asia (IDA & IBRD countries)European UnionFaroe IslandsFijiFinlandFragile and conflict affected situationsFranceFrench PolynesiaGabonGambia, TheGeorgiaGermanyGhanaGibraltarGreeceGrenadaGuamGuatemalaGuineaGuinea-BissauGuyanaHaitiHeavily indebted poor countries (HIPC)High incomeHondurasHong Kong SAR, ChinaHungaryIBRD onlyIcelandIDA & IBRD totalIDA blendIDA onlyIDA totalIndiaIndonesiaIran, Islamic Rep.IraqIrelandIsraelItalyJamaicaJapanJordanKazakhstanKenyaKiribatiKorea, Dem. People’s Rep.Korea, Rep.KuwaitKyrgyz RepublicLao PDRLate-demographic dividendLatin America & Caribbean Latin America & Caribbean (excluding high income)Latin America & the Caribbean (IDA & IBRD countries)LatviaLeast developed countries: UN classificationLebanonLesothoLiberiaLibyaLiechtensteinLithuaniaLow & middle incomeLow incomeLower middle incomeLuxembourgMacao SAR, ChinaMacedonia, FYRMadagascarMalawiMalaysiaMaldivesMaliMaltaMarshall IslandsMauritaniaMauritiusMexicoMicronesia, Fed. Sts.Middle East & North AfricaMiddle East & North Africa (excluding high income)Middle East & North Africa (IDA & IBRD countries)Middle incomeMoldovaMonacoMongoliaMontenegroMoroccoMozambiqueMyanmarNamibiaNauruNepalNetherlandsNew CaledoniaNew ZealandNicaraguaNigerNigeriaNorth AmericaNorwayOECD membersOmanOther small statesPacific island small statesPakistanPalauPanamaPapua New GuineaParaguayPeruPhilippinesPolandPortugalPost-demographic dividendPre-demographic dividendPuerto RicoQatarRomaniaRussian FederationRwandaSamoaSan MarinoSao Tome and PrincipeSaudi ArabiaSenegalSerbiaSeychellesSierra LeoneSingaporeSint Maarten (Dutch part)Slovak RepublicSloveniaSmall statesSolomon IslandsSomaliaSouth AfricaSouth AsiaSouth Asia (IDA & IBRD)SpainSri LankaSt. Kitts and NevisSt. LuciaSt. Vincent and the GrenadinesSub-Saharan Africa Sub-Saharan Africa (excluding high income)Sub-Saharan Africa (IDA & IBRD countries)SudanSurinameSwazilandSwedenSwitzerlandSyrian Arab RepublicTajikistanTanzaniaThailandTimor-LesteTogoTongaTrinidad and TobagoTunisiaTurkeyTurkmenistanTurks and Caicos IslandsTuvaluUgandaUkraineUnited Arab EmiratesUnited KingdomUnited StatesUpper middle incomeUruguayUzbekistanVanuatuVenezuela, RBVietnamVirgin Islands (U.S.)West Bank and GazaWorldYemen, Rep.ZambiaZimbabwe Timeline:
This timeline shows a graph from 1972 to 2014 of Thailand. No data until 1971. Number of actual observations by date: 39.
Source name:
World Development Indicators
Source organization:
UNESCO Institute for Statistics
Categories, topics:
Education
Last updated:
apr 23, 2017
Indicators value changes by year
Minimum:
695.023K
jan 1, 1972
Maximum:
4.893 mln
jan 1, 2012
At the date of observation
Value
Absolute change
Change from previous value
jan 1, 1972
695.023K
+695.023K
0.0%
jan 1, 1973
772.704K
+77.681K
11.18%
jan 1, 1974
868.885K
+96.181K
12.45%
jan 1, 1975
982.295K
+113.41K
13.05%
jan 1, 1976
1.066 mln
+84.191K
8.57%
jan 1, 1977
1.194 mln
+127.255K
11.93%
jan 1, 1978
1.325 mln
+130.798K
10.96%
jan 1, 1979
1.386 mln
+61.597K
4.65%
jan 1, 1980
1.738 mln
+351.787K
25.38%
jan 1, 1981
1.806 mln
+67.785K
3.9%
jan 1, 1982
1.92 mln
+114.259K
6.33%
jan 1, 1983
1.991 mln
+70.899K
3.69%
jan 1, 1985
2.192 mln
+200.847K
10.09%
jan 1, 1986
2.25 mln
+58.067K
2.65%
jan 1, 1987
2.243 mln
-6.407K
-0.28%
jan 1, 1988
2.185 mln
-58.523K
-2.61%
jan 1, 1989
2.109 mln
-75.886K
-3.47%
jan 1, 1990
2.083 mln
-25.727K
-1.22%
jan 1, 1991
2.118 mln
+34.666K
1.66%
jan 1, 1992
2.23 mln
+112.5K
5.31%
jan 1, 1993
2.444 mln
+213.689K
9.58%
jan 1, 1994
2.718 mln
+273.58K
11.19%
jan 1, 1995
3.044 mln
+326.397K
12.01%
jan 1, 1996
3.383 mln
+338.686K
11.13%
jan 1, 1997
3.794 mln
+411.535K
12.17%
jan 1, 1998
3.926 mln
+131.633K
3.47%
jan 1, 1999
4.097 mln
+171.408K
4.37%
jan 1, 2002
4.072 mln
-25.223K
-0.62%
jan 1, 2003
4.15 mln
+78.076K
1.92%
jan 1, 2005
4.253 mln
+103.196K
2.49%
jan 1, 2006
4.533 mln
+279.793K
6.58%
jan 1, 2007
4.53 mln
-3.144K
-0.07%
jan 1, 2008
4.789 mln
+259.31K
5.72%
jan 1, 2009
4.729 mln
-60.578K
-1.26%
jan 1, 2010
4.769 mln
+40.45K
0.86%
jan 1, 2011
4.807 mln
+37.882K
0.79%
jan 1, 2012
4.893 mln
+85.424K
1.78%
jan 1, 2013
4.786 mln
-106.707K
-2.18%
jan 1, 2014
4.655 mln
-130.459K
-2.73%
Ranking of countries by current statistics by years


Comments: