29
/
en
AIzaSyAYiBZKx7MnpbEhh9jyipgxe19OcubqV5w
April 1, 2024
122038
Dominican Republic
DOM
true
2
1
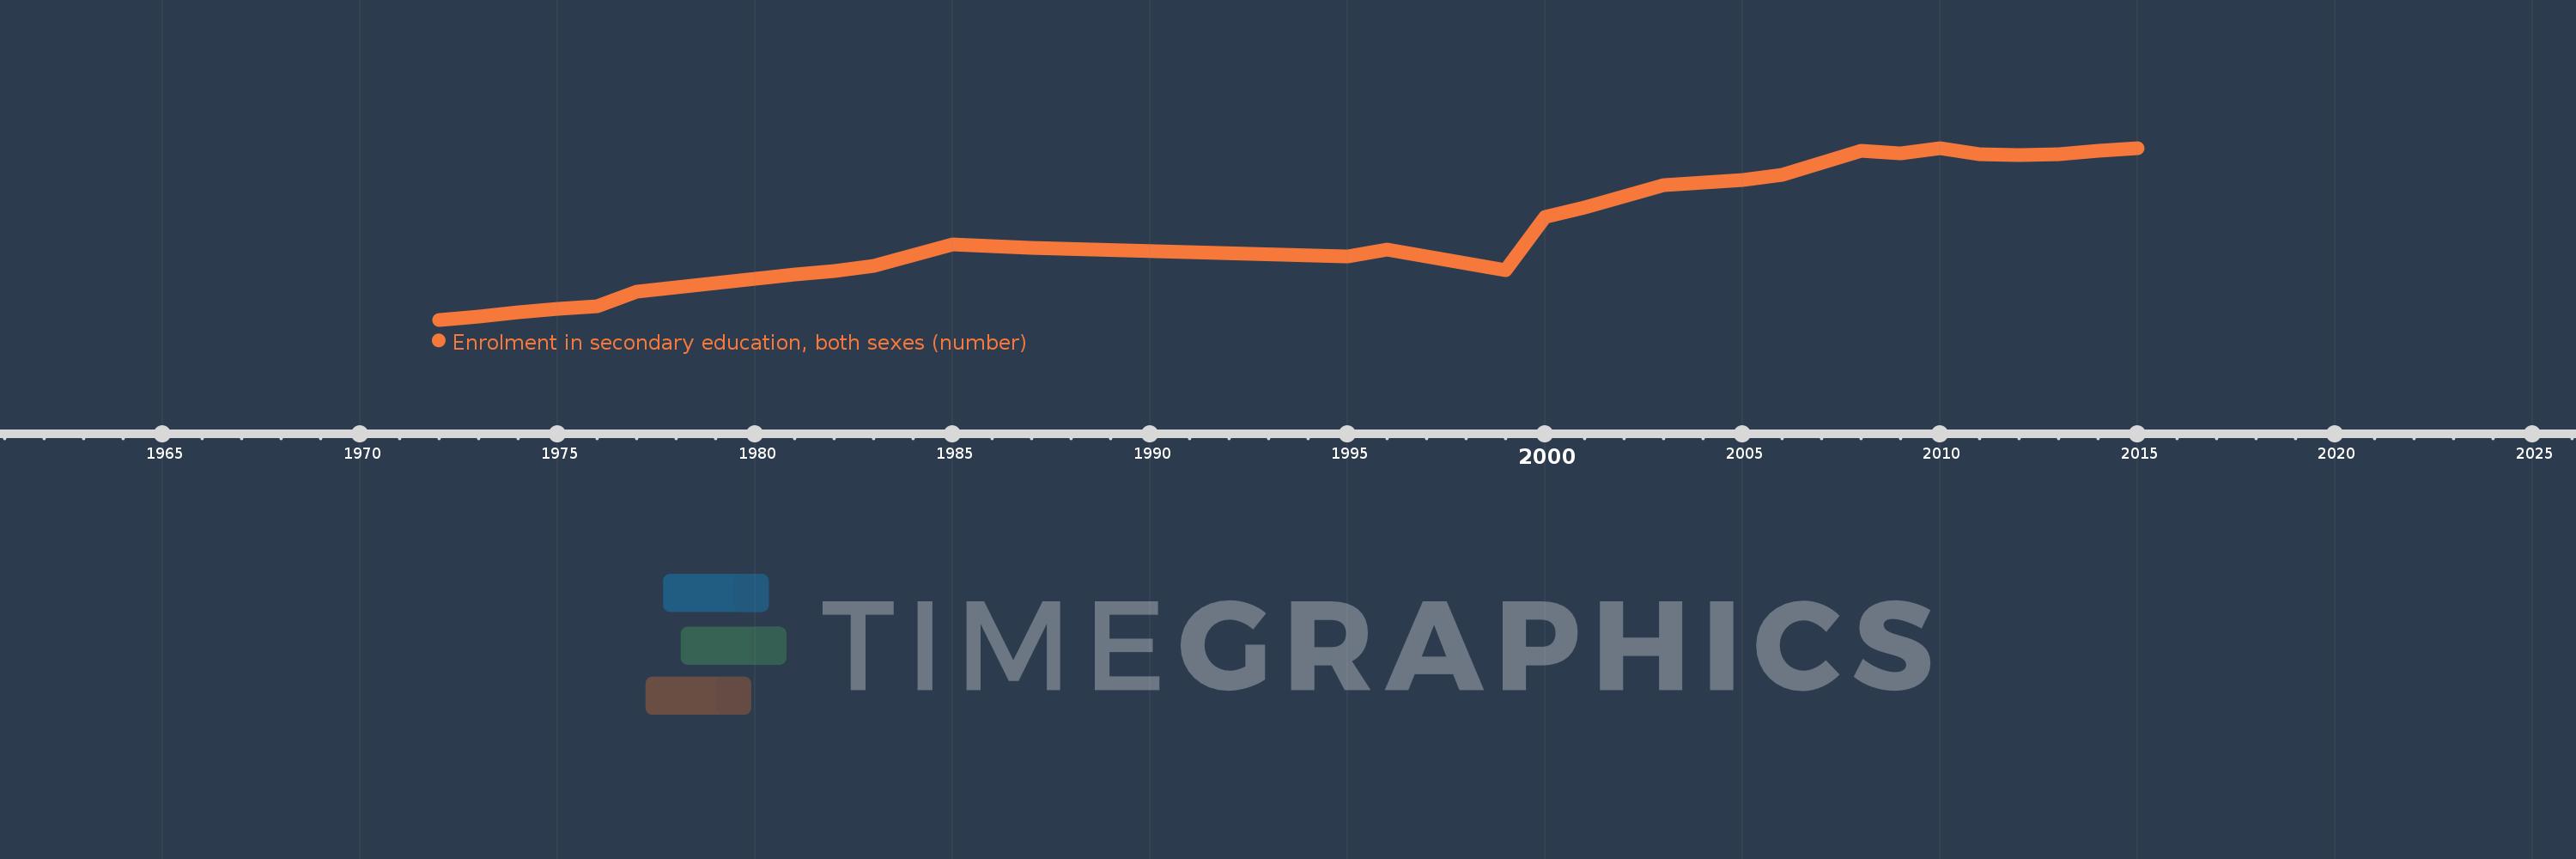
Enrolment in secondary education, both sexes (number)
2015,2014,2013,2012,2011,2010,2009,2008,2006,2005,2003,2001,2000,1999,1996,1995,1987,1985,1983,1982,1981,1980,1979,1978,1977,1976,1975,1974,1973,1972
This statistics in other country:
AfghanistanAlbaniaAlgeriaAmerican SamoaAndorraAngolaAntigua and BarbudaArab WorldArgentinaArmeniaArubaAustraliaAustriaAzerbaijanBahamas, TheBahrainBangladeshBarbadosBelarusBelgiumBelizeBeninBermudaBhutanBoliviaBosnia and HerzegovinaBotswanaBrazilBritish Virgin IslandsBrunei DarussalamBulgariaBurkina FasoBurundiCabo VerdeCambodiaCameroonCanadaCaribbean small statesCayman IslandsCentral African RepublicCentral Europe and the BalticsChadChileChinaColombiaComorosCongo, Dem. Rep.Congo, Rep.Costa RicaCote d'IvoireCroatiaCubaCuracaoCyprusCzech RepublicDenmarkDjiboutiDominicaDominican RepublicEarly-demographic dividendEast Asia & PacificEast Asia & Pacific (excluding high income)East Asia & Pacific (IDA & IBRD countries)EcuadorEgypt, Arab Rep.El SalvadorEquatorial GuineaEritreaEstoniaEthiopiaEuro areaEurope & Central AsiaEurope & Central Asia (excluding high income)Europe & Central Asia (IDA & IBRD countries)European UnionFaroe IslandsFijiFinlandFragile and conflict affected situationsFranceFrench PolynesiaGabonGambia, TheGeorgiaGermanyGhanaGibraltarGreeceGrenadaGuamGuatemalaGuineaGuinea-BissauGuyanaHaitiHeavily indebted poor countries (HIPC)High incomeHondurasHong Kong SAR, ChinaHungaryIBRD onlyIcelandIDA & IBRD totalIDA blendIDA onlyIDA totalIndiaIndonesiaIran, Islamic Rep.IraqIrelandIsraelItalyJamaicaJapanJordanKazakhstanKenyaKiribatiKorea, Dem. People’s Rep.Korea, Rep.KuwaitKyrgyz RepublicLao PDRLate-demographic dividendLatin America & Caribbean Latin America & Caribbean (excluding high income)Latin America & the Caribbean (IDA & IBRD countries)LatviaLeast developed countries: UN classificationLebanonLesothoLiberiaLibyaLiechtensteinLithuaniaLow & middle incomeLow incomeLower middle incomeLuxembourgMacao SAR, ChinaMacedonia, FYRMadagascarMalawiMalaysiaMaldivesMaliMaltaMarshall IslandsMauritaniaMauritiusMexicoMicronesia, Fed. Sts.Middle East & North AfricaMiddle East & North Africa (excluding high income)Middle East & North Africa (IDA & IBRD countries)Middle incomeMoldovaMonacoMongoliaMontenegroMoroccoMozambiqueMyanmarNamibiaNauruNepalNetherlandsNew CaledoniaNew ZealandNicaraguaNigerNigeriaNorth AmericaNorwayOECD membersOmanOther small statesPacific island small statesPakistanPalauPanamaPapua New GuineaParaguayPeruPhilippinesPolandPortugalPost-demographic dividendPre-demographic dividendPuerto RicoQatarRomaniaRussian FederationRwandaSamoaSan MarinoSao Tome and PrincipeSaudi ArabiaSenegalSerbiaSeychellesSierra LeoneSingaporeSint Maarten (Dutch part)Slovak RepublicSloveniaSmall statesSolomon IslandsSomaliaSouth AfricaSouth AsiaSouth Asia (IDA & IBRD)SpainSri LankaSt. Kitts and NevisSt. LuciaSt. Vincent and the GrenadinesSub-Saharan Africa Sub-Saharan Africa (excluding high income)Sub-Saharan Africa (IDA & IBRD countries)SudanSurinameSwazilandSwedenSwitzerlandSyrian Arab RepublicTajikistanTanzaniaThailandTimor-LesteTogoTongaTrinidad and TobagoTunisiaTurkeyTurkmenistanTurks and Caicos IslandsTuvaluUgandaUkraineUnited Arab EmiratesUnited KingdomUnited StatesUpper middle incomeUruguayUzbekistanVanuatuVenezuela, RBVietnamVirgin Islands (U.S.)West Bank and GazaWorldYemen, Rep.ZambiaZimbabwe Timeline:
This timeline shows a graph from 1972 to 2015 of Dominican Republic. No data until 1971. Number of actual observations by date: 30.
Source name:
World Development Indicators
Source organization:
UNESCO Institute for Statistics
Categories, topics:
Education
Last updated:
apr 23, 2017
Indicators value changes by year
Minimum:
126.261K
jan 1, 1972
Maximum:
934.126K
jan 1, 2010
At the date of observation
Value
Absolute change
Change from previous value
jan 1, 1972
126.261K
+126.261K
0.0%
jan 1, 1973
141.07K
+14.809K
11.73%
jan 1, 1974
161.727K
+20.657K
14.64%
jan 1, 1975
176.727K
+15.0K
9.27%
jan 1, 1976
191.095K
+14.368K
8.13%
jan 1, 1977
260.133K
+69.038K
36.13%
jan 1, 1978
279.314K
+19.181K
7.37%
jan 1, 1979
298.293K
+18.979K
6.79%
jan 1, 1980
318.905K
+20.612K
6.91%
jan 1, 1981
337.511K
+18.606K
5.83%
jan 1, 1982
356.091K
+18.58K
5.51%
jan 1, 1983
379.377K
+23.286K
6.54%
jan 1, 1985
480.387K
+101.01K
26.63%
jan 1, 1987
463.511K
-16.876K
-3.51%
jan 1, 1995
425.216K
-38.295K
-8.26%
jan 1, 1996
454.561K
+29.345K
6.9%
jan 1, 1999
359.888K
-94.673K
-20.83%
jan 1, 2000
610.519K
+250.631K
69.64%
jan 1, 2001
653.558K
+43.039K
7.05%
jan 1, 2003
757.79K
+104.232K
15.95%
jan 1, 2005
782.69K
+24.9K
3.29%
jan 1, 2006
808.352K
+25.662K
3.28%
jan 1, 2008
920.494K
+112.142K
13.87%
jan 1, 2009
909.331K
-11.163K
-1.21%
jan 1, 2010
934.126K
+24.795K
2.73%
jan 1, 2011
904.527K
-29.599K
-3.17%
jan 1, 2012
898.69K
-5.837K
-0.65%
jan 1, 2013
905.616K
+6.926K
0.77%
jan 1, 2014
919.763K
+14.147K
1.56%
jan 1, 2015
931.068K
+11.305K
1.23%
Ranking of countries by current statistics by years


Comments: