29
/
en
AIzaSyAYiBZKx7MnpbEhh9jyipgxe19OcubqV5w
April 1, 2024
272155
Uganda
UGA
true
2
1
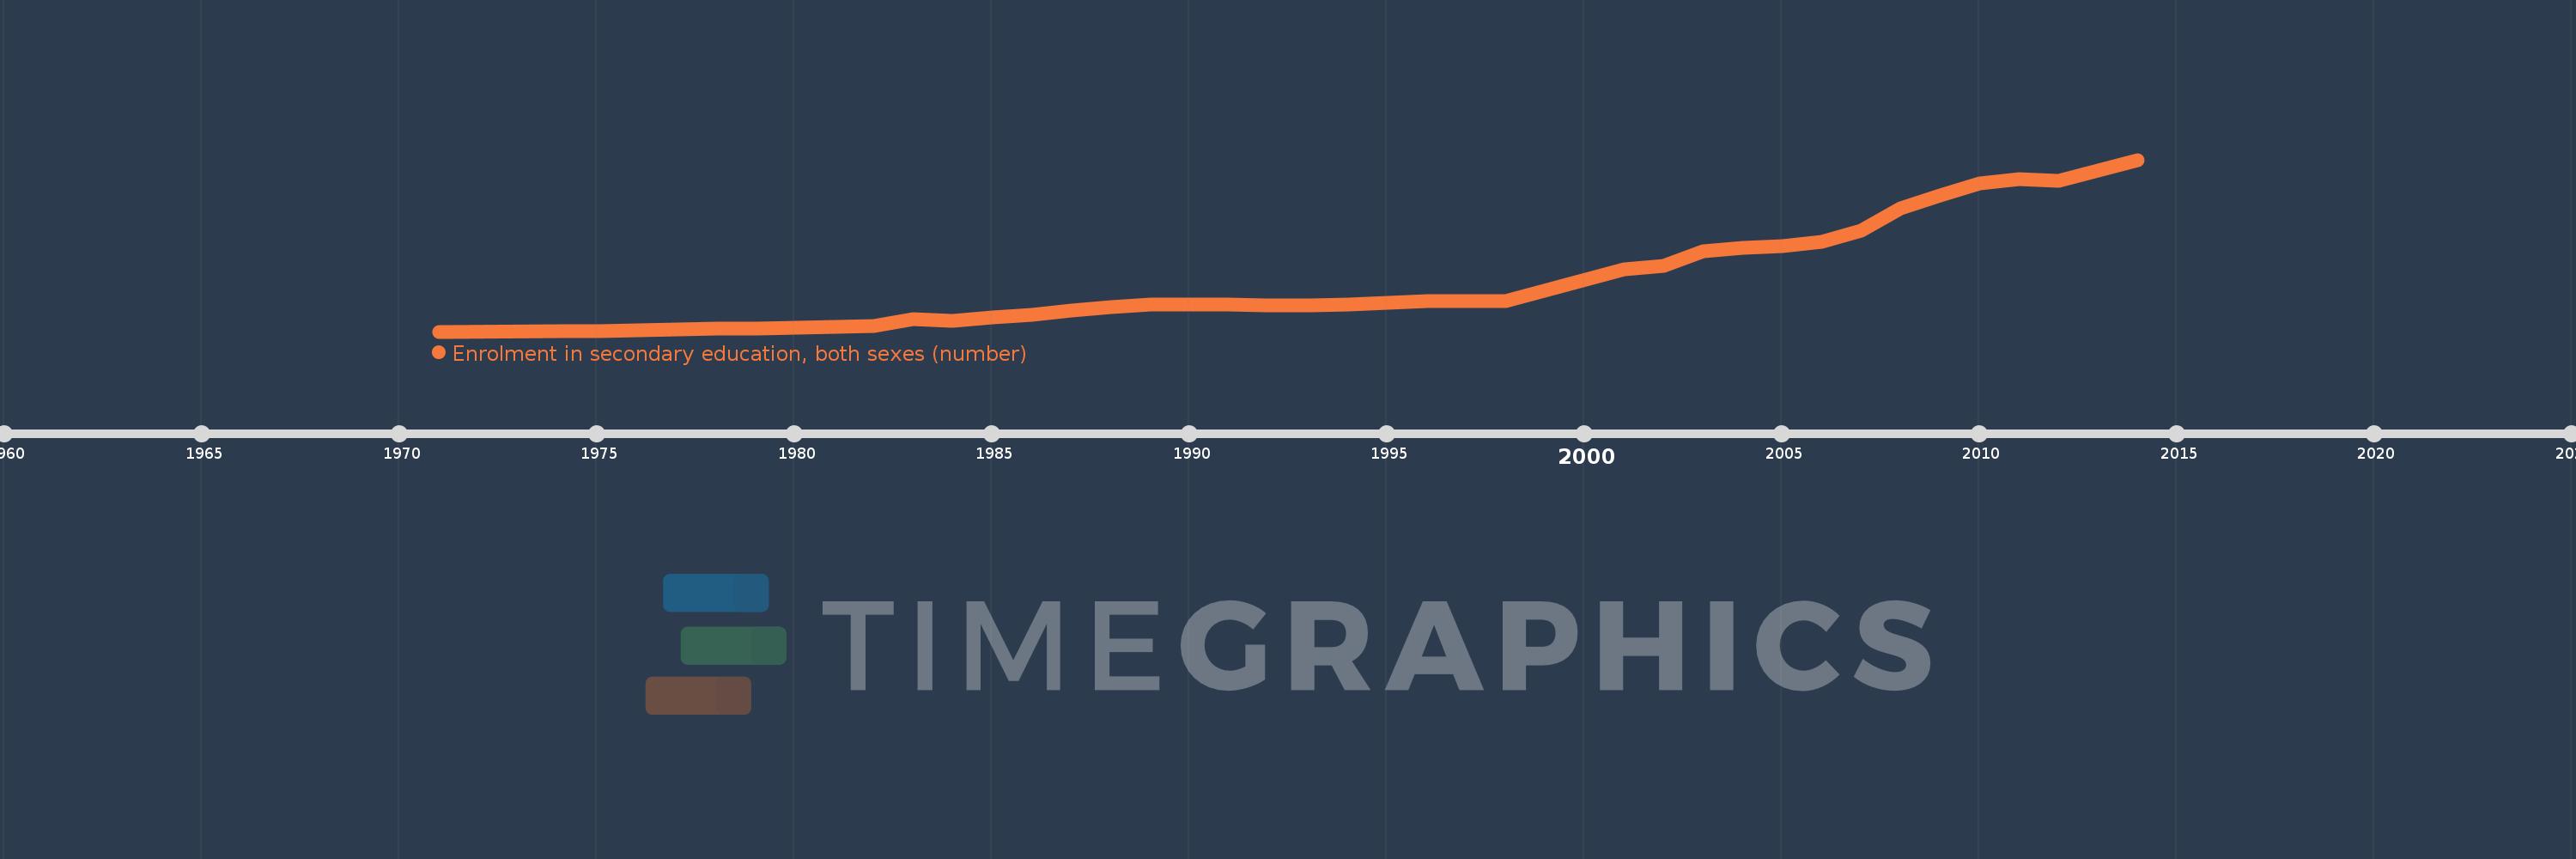
Enrolment in secondary education, both sexes (number)
2014,2012,2011,2010,2009,2008,2007,2006,2005,2004,2003,2002,2001,1998,1996,1995,1994,1993,1992,1991,1989,1988,1987,1986,1985,1984,1983,1982,1981,1980,1979,1978,1977,1976,1975,1974,1971
This statistics in other country:
AfghanistanAlbaniaAlgeriaAmerican SamoaAndorraAngolaAntigua and BarbudaArab WorldArgentinaArmeniaArubaAustraliaAustriaAzerbaijanBahamas, TheBahrainBangladeshBarbadosBelarusBelgiumBelizeBeninBermudaBhutanBoliviaBosnia and HerzegovinaBotswanaBrazilBritish Virgin IslandsBrunei DarussalamBulgariaBurkina FasoBurundiCabo VerdeCambodiaCameroonCanadaCaribbean small statesCayman IslandsCentral African RepublicCentral Europe and the BalticsChadChileChinaColombiaComorosCongo, Dem. Rep.Congo, Rep.Costa RicaCote d'IvoireCroatiaCubaCuracaoCyprusCzech RepublicDenmarkDjiboutiDominicaDominican RepublicEarly-demographic dividendEast Asia & PacificEast Asia & Pacific (excluding high income)East Asia & Pacific (IDA & IBRD countries)EcuadorEgypt, Arab Rep.El SalvadorEquatorial GuineaEritreaEstoniaEthiopiaEuro areaEurope & Central AsiaEurope & Central Asia (excluding high income)Europe & Central Asia (IDA & IBRD countries)European UnionFaroe IslandsFijiFinlandFragile and conflict affected situationsFranceFrench PolynesiaGabonGambia, TheGeorgiaGermanyGhanaGibraltarGreeceGrenadaGuamGuatemalaGuineaGuinea-BissauGuyanaHaitiHeavily indebted poor countries (HIPC)High incomeHondurasHong Kong SAR, ChinaHungaryIBRD onlyIcelandIDA & IBRD totalIDA blendIDA onlyIDA totalIndiaIndonesiaIran, Islamic Rep.IraqIrelandIsraelItalyJamaicaJapanJordanKazakhstanKenyaKiribatiKorea, Dem. People’s Rep.Korea, Rep.KuwaitKyrgyz RepublicLao PDRLate-demographic dividendLatin America & Caribbean Latin America & Caribbean (excluding high income)Latin America & the Caribbean (IDA & IBRD countries)LatviaLeast developed countries: UN classificationLebanonLesothoLiberiaLibyaLiechtensteinLithuaniaLow & middle incomeLow incomeLower middle incomeLuxembourgMacao SAR, ChinaMacedonia, FYRMadagascarMalawiMalaysiaMaldivesMaliMaltaMarshall IslandsMauritaniaMauritiusMexicoMicronesia, Fed. Sts.Middle East & North AfricaMiddle East & North Africa (excluding high income)Middle East & North Africa (IDA & IBRD countries)Middle incomeMoldovaMonacoMongoliaMontenegroMoroccoMozambiqueMyanmarNamibiaNauruNepalNetherlandsNew CaledoniaNew ZealandNicaraguaNigerNigeriaNorth AmericaNorwayOECD membersOmanOther small statesPacific island small statesPakistanPalauPanamaPapua New GuineaParaguayPeruPhilippinesPolandPortugalPost-demographic dividendPre-demographic dividendPuerto RicoQatarRomaniaRussian FederationRwandaSamoaSan MarinoSao Tome and PrincipeSaudi ArabiaSenegalSerbiaSeychellesSierra LeoneSingaporeSint Maarten (Dutch part)Slovak RepublicSloveniaSmall statesSolomon IslandsSomaliaSouth AfricaSouth AsiaSouth Asia (IDA & IBRD)SpainSri LankaSt. Kitts and NevisSt. LuciaSt. Vincent and the GrenadinesSub-Saharan Africa Sub-Saharan Africa (excluding high income)Sub-Saharan Africa (IDA & IBRD countries)SudanSurinameSwazilandSwedenSwitzerlandSyrian Arab RepublicTajikistanTanzaniaThailandTimor-LesteTogoTongaTrinidad and TobagoTunisiaTurkeyTurkmenistanTurks and Caicos IslandsTuvaluUgandaUkraineUnited Arab EmiratesUnited KingdomUnited StatesUpper middle incomeUruguayUzbekistanVanuatuVenezuela, RBVietnamVirgin Islands (U.S.)West Bank and GazaWorldYemen, Rep.ZambiaZimbabwe Timeline:
This timeline shows a graph from 1971 to 2014 of Uganda. No data until 1970. Number of actual observations by date: 37.
Source name:
World Development Indicators
Source organization:
UNESCO Institute for Statistics
Categories, topics:
Education
Last updated:
apr 23, 2017
Indicators value changes by year
Minimum:
48.221K
jan 1, 1971
Maximum:
1.421 mln
jan 1, 2014
At the date of observation
Value
Absolute change
Change from previous value
jan 1, 1971
48.221K
+48.221K
0.0%
jan 1, 1974
52.67K
+4.449K
9.23%
jan 1, 1975
53.586K
+916.0
1.74%
jan 1, 1976
55.263K
+1.677K
3.13%
jan 1, 1977
66.986K
+11.723K
21.21%
jan 1, 1978
70.647K
+3.661K
5.47%
jan 1, 1979
74.032K
+3.385K
4.79%
jan 1, 1980
77.929K
+3.897K
5.26%
jan 1, 1981
86.56K
+8.631K
11.08%
jan 1, 1982
94.614K
+8.054K
9.3%
jan 1, 1983
145.389K
+50.775K
53.67%
jan 1, 1984
133.393K
-11.996K
-8.25%
jan 1, 1985
162.005K
+28.612K
21.45%
jan 1, 1986
179.483K
+17.478K
10.79%
jan 1, 1987
213.733K
+34.25K
19.08%
jan 1, 1988
242.727K
+28.994K
13.57%
jan 1, 1989
262.735K
+20.008K
8.24%
jan 1, 1991
267.517K
+4.782K
1.82%
jan 1, 1992
256.194K
-11.323K
-4.23%
jan 1, 1993
256.669K
+475.0
0.19%
jan 1, 1994
261.762K
+5.093K
1.98%
jan 1, 1995
275.59K
+13.828K
5.28%
jan 1, 1996
292.321K
+16.731K
6.07%
jan 1, 1998
294.418K
+2.097K
0.72%
jan 1, 2001
546.977K
+252.559K
85.78%
jan 1, 2002
570.52K
+23.543K
4.3%
jan 1, 2003
687.613K
+117.093K
20.52%
jan 1, 2004
716.736K
+29.123K
4.24%
jan 1, 2005
732.792K
+16.056K
2.24%
jan 1, 2006
767.243K
+34.451K
4.7%
jan 1, 2007
857.776K
+90.533K
11.8%
jan 1, 2008
1.032 mln
+173.744K
20.26%
jan 1, 2009
1.137 mln
+105.309K
10.21%
jan 1, 2010
1.233 mln
+96.553K
8.49%
jan 1, 2011
1.265 mln
+31.56K
2.56%
jan 1, 2012
1.254 mln
-11.141K
-0.88%
jan 1, 2014
1.421 mln
+167.436K
13.35%
Ranking of countries by current statistics by years


Comments: