29
/
en
AIzaSyAYiBZKx7MnpbEhh9jyipgxe19OcubqV5w
April 1, 2024
36517
IBRD only
IBD
false
2
1
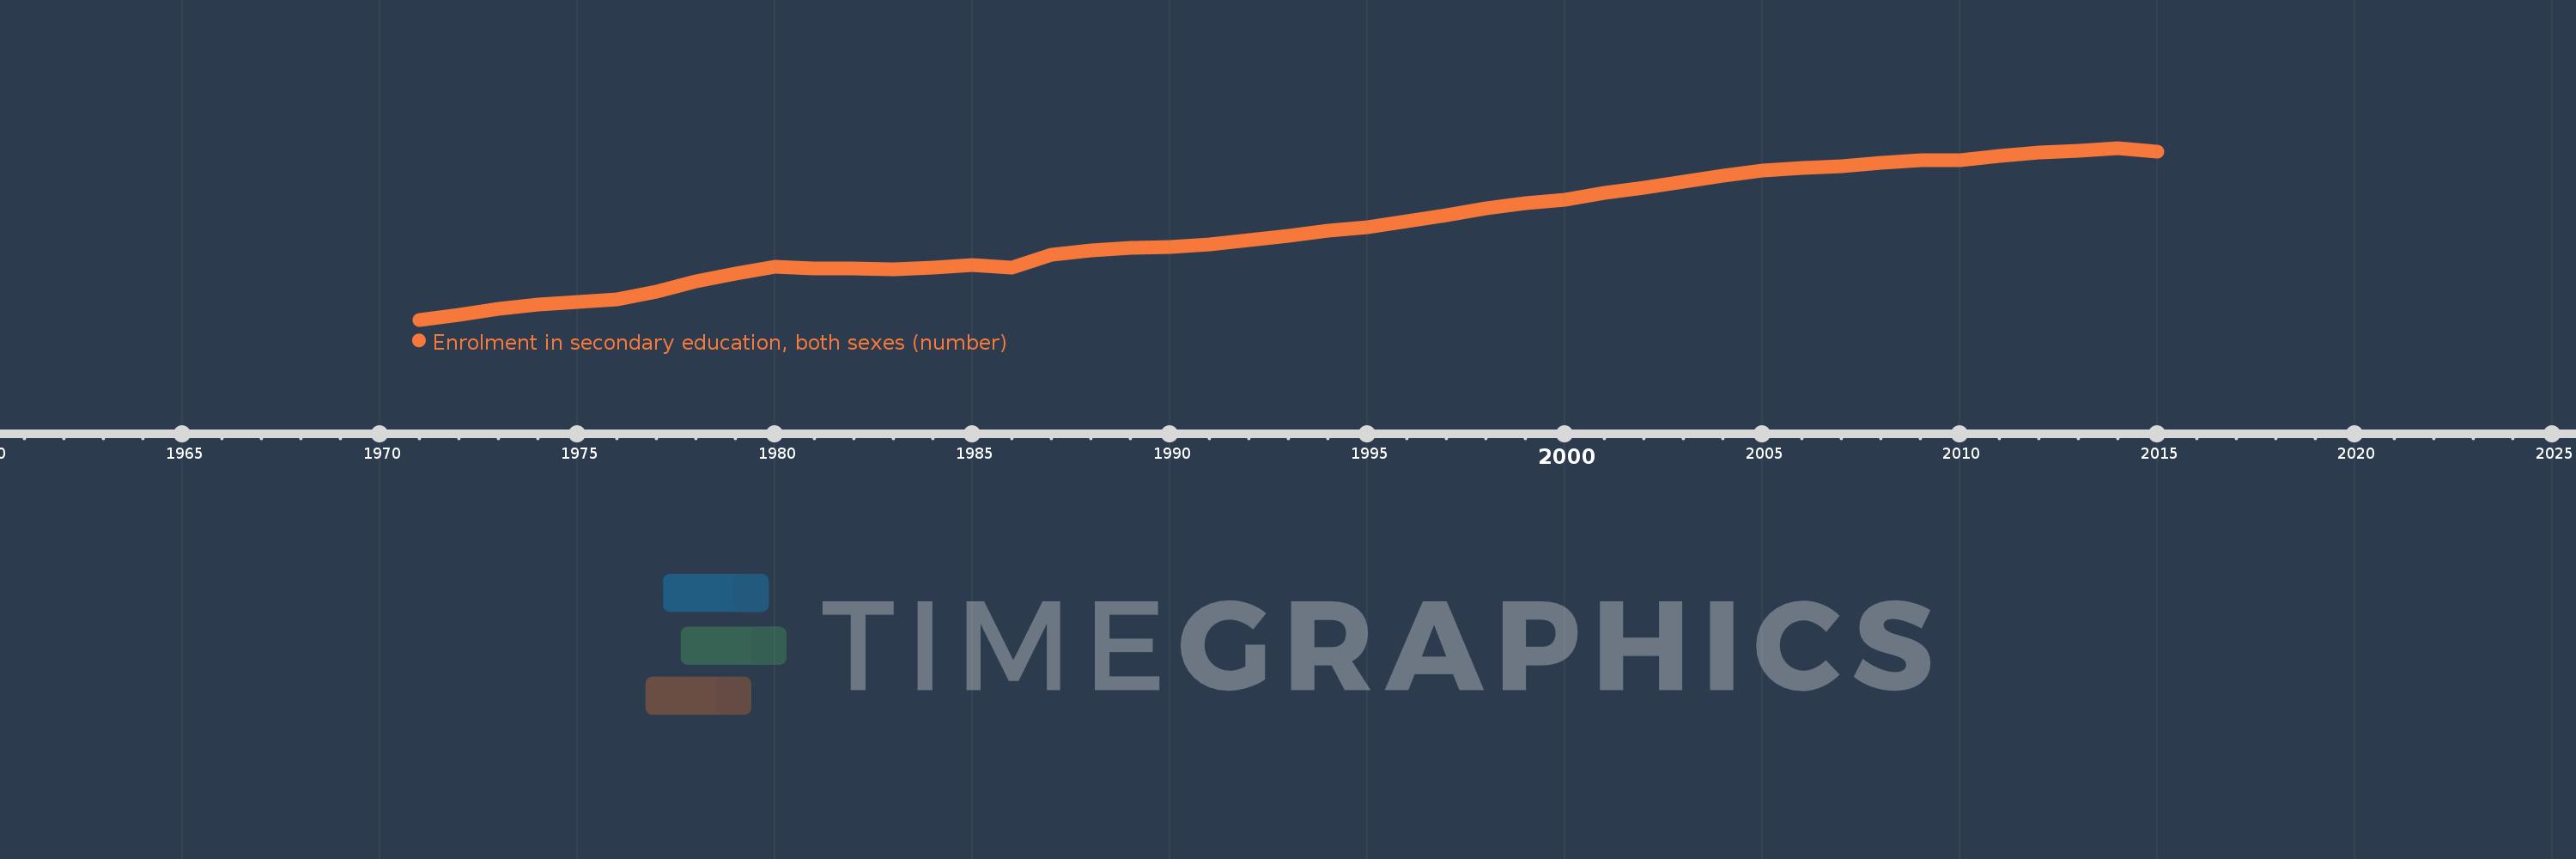
Enrolment in secondary education, both sexes (number)
2015,2014,2013,2012,2011,2010,2009,2008,2007,2006,2005,2004,2003,2002,2001,2000,1999,1998,1997,1996,1995,1994,1993,1992,1991,1990,1989,1988,1987,1986,1985,1984,1983,1982,1981,1980,1979,1978,1977,1976,1975,1974,1973,1972,1971
This statistics in other country:
AfghanistanAlbaniaAlgeriaAmerican SamoaAndorraAngolaAntigua and BarbudaArab WorldArgentinaArmeniaArubaAustraliaAustriaAzerbaijanBahamas, TheBahrainBangladeshBarbadosBelarusBelgiumBelizeBeninBermudaBhutanBoliviaBosnia and HerzegovinaBotswanaBrazilBritish Virgin IslandsBrunei DarussalamBulgariaBurkina FasoBurundiCabo VerdeCambodiaCameroonCanadaCaribbean small statesCayman IslandsCentral African RepublicCentral Europe and the BalticsChadChileChinaColombiaComorosCongo, Dem. Rep.Congo, Rep.Costa RicaCote d'IvoireCroatiaCubaCuracaoCyprusCzech RepublicDenmarkDjiboutiDominicaDominican RepublicEarly-demographic dividendEast Asia & PacificEast Asia & Pacific (excluding high income)East Asia & Pacific (IDA & IBRD countries)EcuadorEgypt, Arab Rep.El SalvadorEquatorial GuineaEritreaEstoniaEthiopiaEuro areaEurope & Central AsiaEurope & Central Asia (excluding high income)Europe & Central Asia (IDA & IBRD countries)European UnionFaroe IslandsFijiFinlandFragile and conflict affected situationsFranceFrench PolynesiaGabonGambia, TheGeorgiaGermanyGhanaGibraltarGreeceGrenadaGuamGuatemalaGuineaGuinea-BissauGuyanaHaitiHeavily indebted poor countries (HIPC)High incomeHondurasHong Kong SAR, ChinaHungaryIBRD onlyIcelandIDA & IBRD totalIDA blendIDA onlyIDA totalIndiaIndonesiaIran, Islamic Rep.IraqIrelandIsraelItalyJamaicaJapanJordanKazakhstanKenyaKiribatiKorea, Dem. People’s Rep.Korea, Rep.KuwaitKyrgyz RepublicLao PDRLate-demographic dividendLatin America & Caribbean Latin America & Caribbean (excluding high income)Latin America & the Caribbean (IDA & IBRD countries)LatviaLeast developed countries: UN classificationLebanonLesothoLiberiaLibyaLiechtensteinLithuaniaLow & middle incomeLow incomeLower middle incomeLuxembourgMacao SAR, ChinaMacedonia, FYRMadagascarMalawiMalaysiaMaldivesMaliMaltaMarshall IslandsMauritaniaMauritiusMexicoMicronesia, Fed. Sts.Middle East & North AfricaMiddle East & North Africa (excluding high income)Middle East & North Africa (IDA & IBRD countries)Middle incomeMoldovaMonacoMongoliaMontenegroMoroccoMozambiqueMyanmarNamibiaNauruNepalNetherlandsNew CaledoniaNew ZealandNicaraguaNigerNigeriaNorth AmericaNorwayOECD membersOmanOther small statesPacific island small statesPakistanPalauPanamaPapua New GuineaParaguayPeruPhilippinesPolandPortugalPost-demographic dividendPre-demographic dividendPuerto RicoQatarRomaniaRussian FederationRwandaSamoaSan MarinoSao Tome and PrincipeSaudi ArabiaSenegalSerbiaSeychellesSierra LeoneSingaporeSint Maarten (Dutch part)Slovak RepublicSloveniaSmall statesSolomon IslandsSomaliaSouth AfricaSouth AsiaSouth Asia (IDA & IBRD)SpainSri LankaSt. Kitts and NevisSt. LuciaSt. Vincent and the GrenadinesSub-Saharan Africa Sub-Saharan Africa (excluding high income)Sub-Saharan Africa (IDA & IBRD countries)SudanSurinameSwazilandSwedenSwitzerlandSyrian Arab RepublicTajikistanTanzaniaThailandTimor-LesteTogoTongaTrinidad and TobagoTunisiaTurkeyTurkmenistanTurks and Caicos IslandsTuvaluUgandaUkraineUnited Arab EmiratesUnited KingdomUnited StatesUpper middle incomeUruguayUzbekistanVanuatuVenezuela, RBVietnamVirgin Islands (U.S.)West Bank and GazaWorldYemen, Rep.ZambiaZimbabwe Timeline:
This timeline shows a graph from 1971 to 2015 of IBRD only. No data until 1970. Number of actual observations by date: 45.
Source name:
World Development Indicators
Source organization:
UNESCO Institute for Statistics
Categories, topics:
Education
Last updated:
apr 23, 2017
Indicators value changes by year
Minimum:
99.806 mln
jan 1, 1971
Maximum:
379.171 mln
jan 1, 2014
At the date of observation
Value
Absolute change
Change from previous value
jan 1, 1971
99.806 mln
+99.806 mln
0.0%
jan 1, 1972
108.154 mln
+8.348 mln
8.36%
jan 1, 1973
117.072 mln
+8.917 mln
8.25%
jan 1, 1974
124.958 mln
+7.887 mln
6.74%
jan 1, 1975
128.081 mln
+3.123 mln
2.5%
jan 1, 1976
133.542 mln
+5.461 mln
4.26%
jan 1, 1977
145.024 mln
+11.482 mln
8.6%
jan 1, 1978
162.003 mln
+16.979 mln
11.71%
jan 1, 1979
174.388 mln
+12.385 mln
7.64%
jan 1, 1980
186.658 mln
+12.27 mln
7.04%
jan 1, 1981
183.579 mln
-3.079 mln
-1.65%
jan 1, 1982
183.636 mln
+56.64K
0.03%
jan 1, 1983
181.344 mln
-2.292 mln
-1.25%
jan 1, 1984
183.908 mln
+2.565 mln
1.41%
jan 1, 1985
188.664 mln
+4.756 mln
2.59%
jan 1, 1986
184.376 mln
-4.288 mln
-2.27%
jan 1, 1987
205.176 mln
+20.8 mln
11.28%
jan 1, 1988
211.982 mln
+6.805 mln
3.32%
jan 1, 1989
216.743 mln
+4.761 mln
2.25%
jan 1, 1990
218.663 mln
+1.92 mln
0.89%
jan 1, 1991
222.997 mln
+4.335 mln
1.98%
jan 1, 1992
228.96 mln
+5.962 mln
2.67%
jan 1, 1993
236.071 mln
+7.112 mln
3.11%
jan 1, 1994
244.313 mln
+8.241 mln
3.49%
jan 1, 1995
250.653 mln
+6.34 mln
2.6%
jan 1, 1996
259.398 mln
+8.745 mln
3.49%
jan 1, 1997
269.799 mln
+10.401 mln
4.01%
jan 1, 1998
280.783 mln
+10.984 mln
4.07%
jan 1, 1999
288.751 mln
+7.968 mln
2.84%
jan 1, 2000
294.88 mln
+6.129 mln
2.12%
jan 1, 2001
306.675 mln
+11.795 mln
4.0%
jan 1, 2002
314.625 mln
+7.95 mln
2.59%
jan 1, 2003
324.825 mln
+10.199 mln
3.24%
jan 1, 2004
334.737 mln
+9.912 mln
3.05%
jan 1, 2005
342.26 mln
+7.522 mln
2.25%
jan 1, 2006
346.844 mln
+4.584 mln
1.34%
jan 1, 2007
349.449 mln
+2.606 mln
0.75%
jan 1, 2008
355.061 mln
+5.612 mln
1.61%
jan 1, 2009
359.577 mln
+4.516 mln
1.27%
jan 1, 2010
359.428 mln
-149.184K
-0.04%
jan 1, 2011
365.672 mln
+6.245 mln
1.74%
jan 1, 2012
371.915 mln
+6.242 mln
1.71%
jan 1, 2013
375.19 mln
+3.275 mln
0.88%
jan 1, 2014
379.171 mln
+3.981 mln
1.06%
jan 1, 2015
373.635 mln
-5.536 mln
-1.46%
Ranking of countries by current statistics by years


Comments: