29
/
en
AIzaSyAYiBZKx7MnpbEhh9jyipgxe19OcubqV5w
April 1, 2024
65375
Albania
ALB
true
2
1
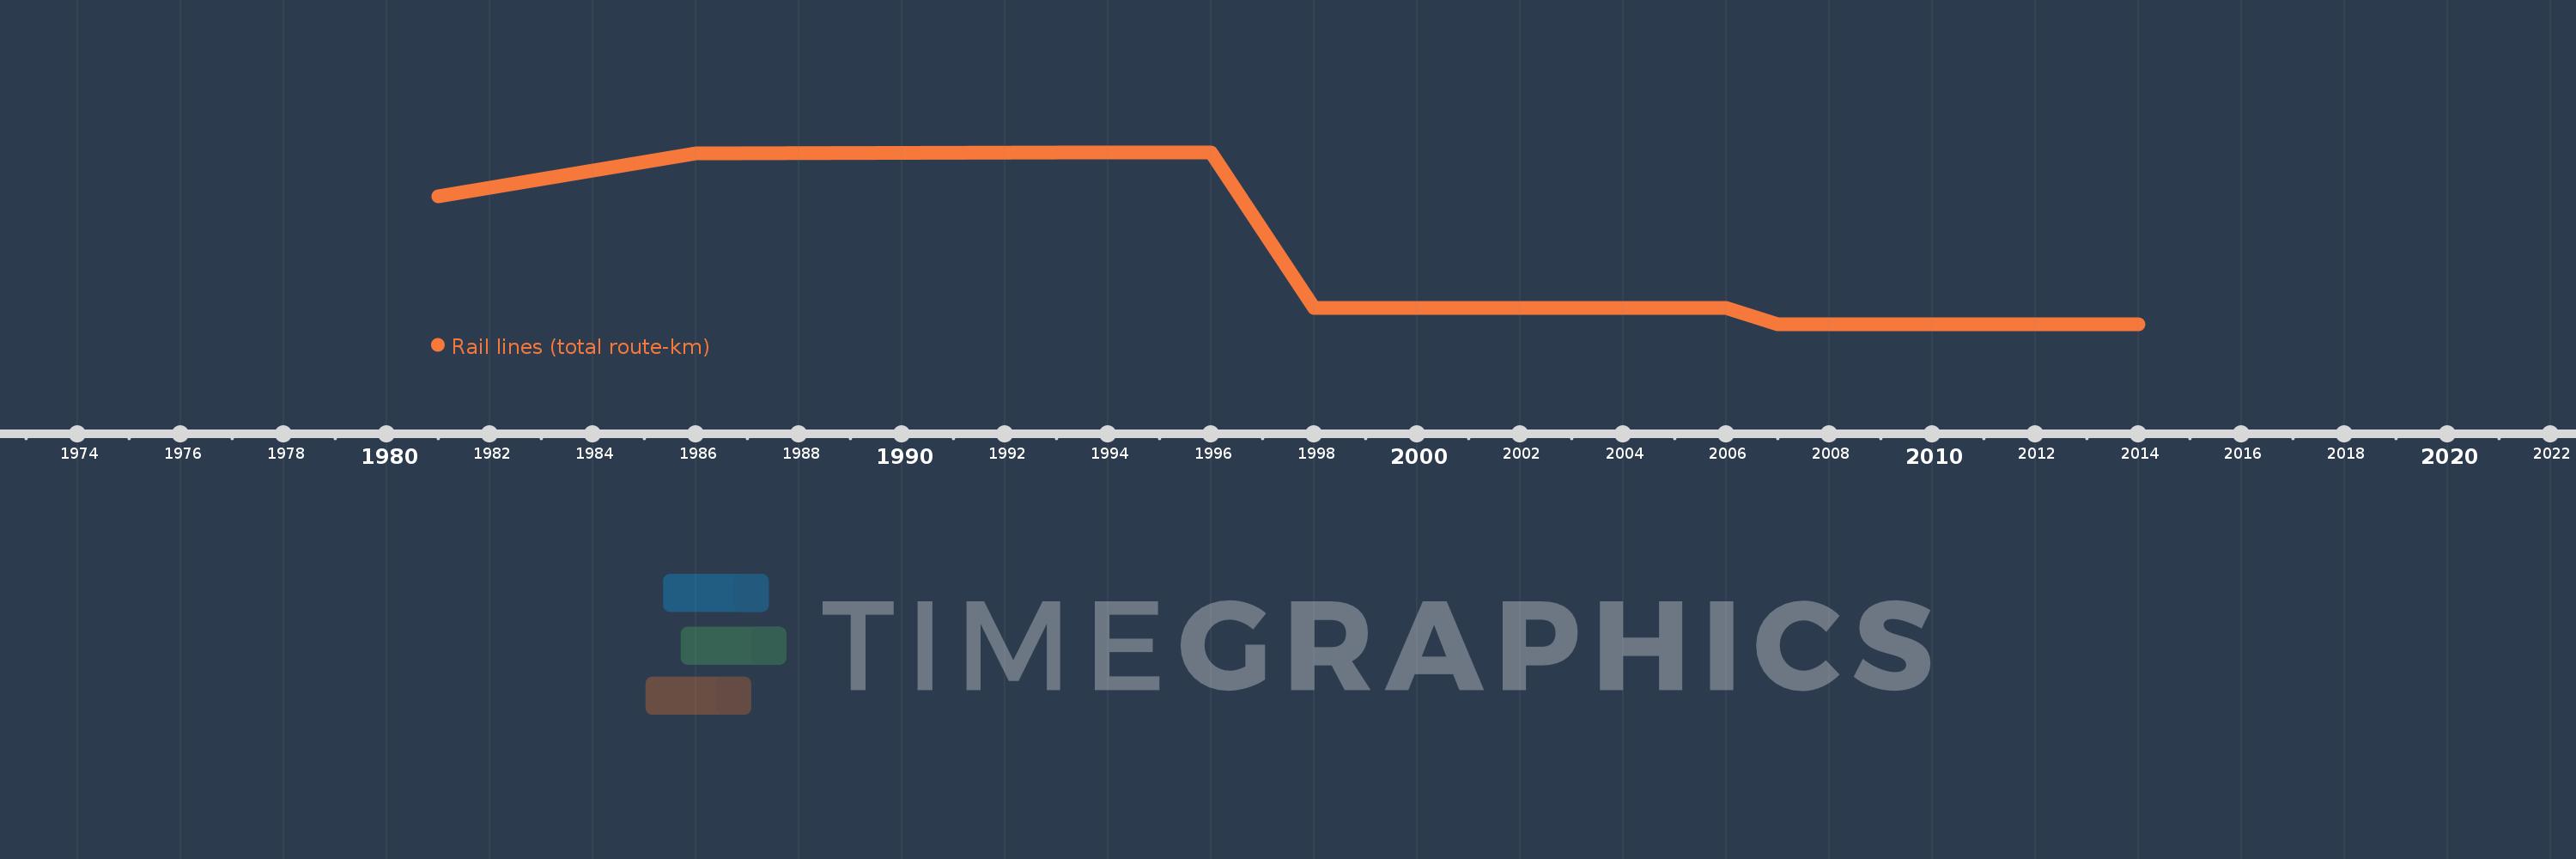
Rail lines (total route-km)
2014,2013,2012,2011,2010,2009,2008,2007,2006,2005,2004,2003,2002,1998,1996,1995,1994,1993,1986,1981
This statistics in other country:
Timeline:
This timeline shows a graph from 1981 to 2014 of Albania. No data until 1980. Number of actual observations by date: 20.
Source name:
World Development Indicators
Source organization:
World Bank, Transportation, Water, and Information and Communications Technologies Department, Transport Division.
Categories, topics:
Infrastructure
Last updated:
apr 23, 2017
Indicators value changes by year
At the date of observation
Value
Absolute change
Change from previous value
jan 1, 1981
610.0
+610.0
0.0%
jan 1, 1986
672.0
+62.0
10.16%
jan 1, 1993
674.0
+2.0
0.3%
jan 1, 1994
674.0
0.0
0.0%
jan 1, 1995
674.0
0.0
0.0%
jan 1, 1996
674.0
0.0
0.0%
jan 1, 1998
447.0
-227.0
-33.68%
jan 1, 2002
447.0
0.0
0.0%
jan 1, 2003
447.0
0.0
0.0%
jan 1, 2004
447.0
0.0
0.0%
jan 1, 2005
447.0
0.0
0.0%
jan 1, 2006
447.0
0.0
0.0%
jan 1, 2007
423.0
-24.0
-5.37%
jan 1, 2008
423.0
0.0
0.0%
jan 1, 2009
423.0
0.0
0.0%
jan 1, 2010
423.0
0.0
0.0%
jan 1, 2011
423.0
0.0
0.0%
jan 1, 2012
423.0
0.0
0.0%
jan 1, 2013
423.0
0.0
0.0%
jan 1, 2014
423.0
0.0
0.0%
Ranking of countries by current statistics by years


Comments: