29
/
en
AIzaSyAYiBZKx7MnpbEhh9jyipgxe19OcubqV5w
April 1, 2024
32143
Europe & Central Asia (excluding high income)
ECA
false
2
1
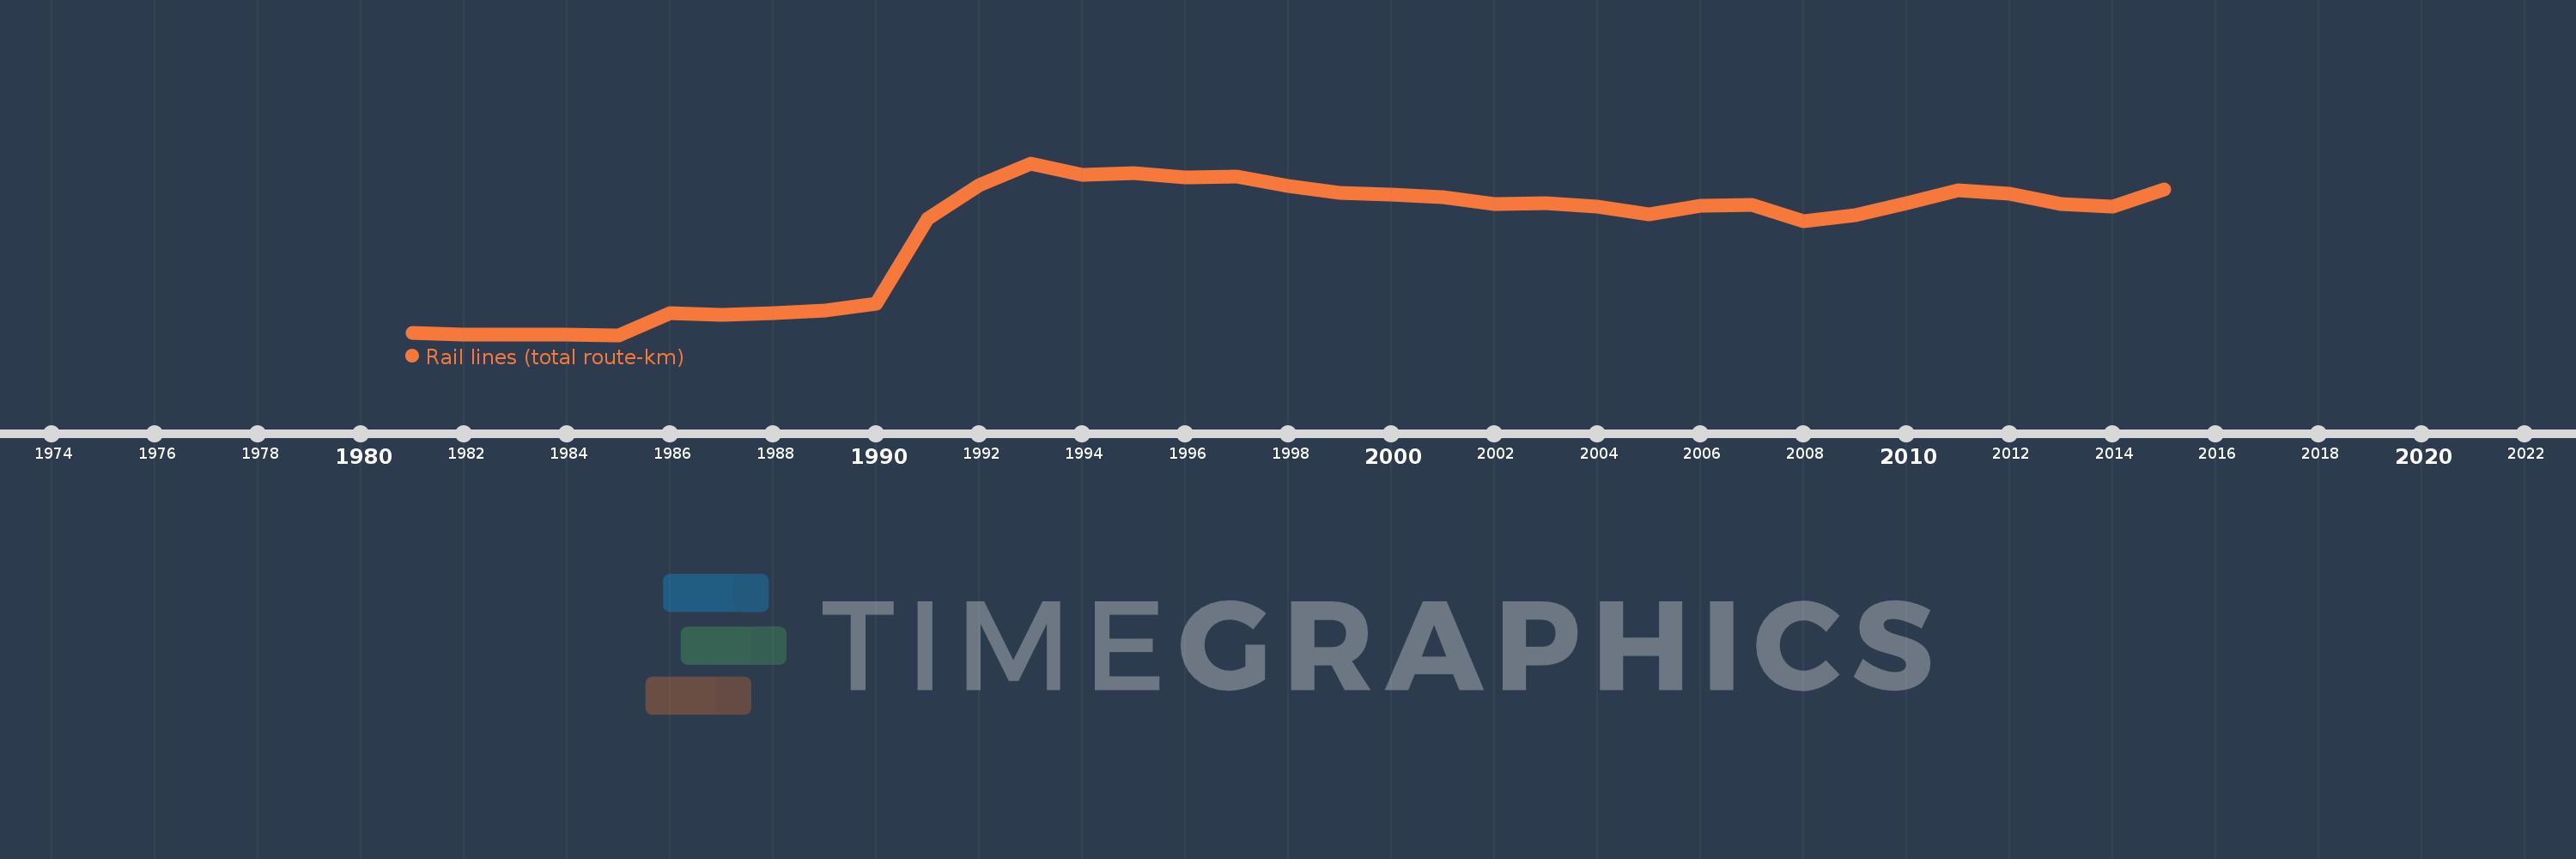
Rail lines (total route-km)
2015,2014,2013,2012,2011,2010,2009,2008,2007,2006,2005,2004,2003,2002,2001,2000,1999,1998,1997,1996,1995,1994,1993,1992,1991,1990,1989,1988,1987,1986,1985,1984,1983,1982,1981
This statistics in other country:
Timeline:
This timeline shows a graph from 1981 to 2015 of Europe & Central Asia (excluding high income). No data until 1980. Number of actual observations by date: 35.
Source name:
World Development Indicators
Source organization:
World Bank, Transportation, Water, and Information and Communications Technologies Department, Transport Division.
Categories, topics:
Infrastructure
Last updated:
apr 23, 2017
Indicators value changes by year
Minimum:
160.252K
jan 1, 1985
Maximum:
173.45K
jan 1, 1993
At the date of observation
Value
Absolute change
Change from previous value
jan 1, 1981
160.437K
+160.437K
0.0%
jan 1, 1982
160.258K
-179.0
-0.11%
jan 1, 1983
160.255K
-3.0
0.0%
jan 1, 1984
160.273K
+18.0
0.01%
jan 1, 1985
160.252K
-21.0
-0.01%
jan 1, 1986
161.922K
+1.67K
1.04%
jan 1, 1987
161.833K
-89.0
-0.05%
jan 1, 1988
161.92K
+87.0
0.05%
jan 1, 1989
162.154K
+234.0
0.14%
jan 1, 1990
162.642K
+488.0
0.3%
jan 1, 1991
169.21K
+6.568K
4.04%
jan 1, 1992
171.79K
+2.579K
1.52%
jan 1, 1993
173.45K
+1.661K
0.97%
jan 1, 1994
172.588K
-862.2
-0.5%
jan 1, 1995
172.659K
+71.0
0.04%
jan 1, 1996
172.376K
-283.0
-0.16%
jan 1, 1997
172.427K
+50.842
0.03%
jan 1, 1998
171.711K
-715.842
-0.42%
jan 1, 1999
171.176K
-535.0
-0.31%
jan 1, 2000
171.043K
-133.0
-0.08%
jan 1, 2001
170.827K
-216.0
-0.13%
jan 1, 2002
170.284K
-543.0
-0.32%
jan 1, 2003
170.391K
+107.0
0.06%
jan 1, 2004
170.101K
-290.0
-0.17%
jan 1, 2005
169.492K
-609.0
-0.36%
jan 1, 2006
170.169K
+677.0
0.4%
jan 1, 2007
170.247K
+78.0
0.05%
jan 1, 2008
169.028K
-1.219K
-0.72%
jan 1, 2009
169.425K
+397.0
0.23%
jan 1, 2010
170.4K
+975.0
0.58%
jan 1, 2011
171.384K
+984.0
0.58%
jan 1, 2012
171.109K
-275.0
-0.16%
jan 1, 2013
170.321K
-788.0
-0.46%
jan 1, 2014
170.13K
-191.4
-0.11%
jan 1, 2015
171.414K
+1.284K
0.75%
Ranking of countries by current statistics by years


Comments: