29
/
en
AIzaSyAYiBZKx7MnpbEhh9jyipgxe19OcubqV5w
April 1, 2024
160942
Israel
ISR
true
2
1
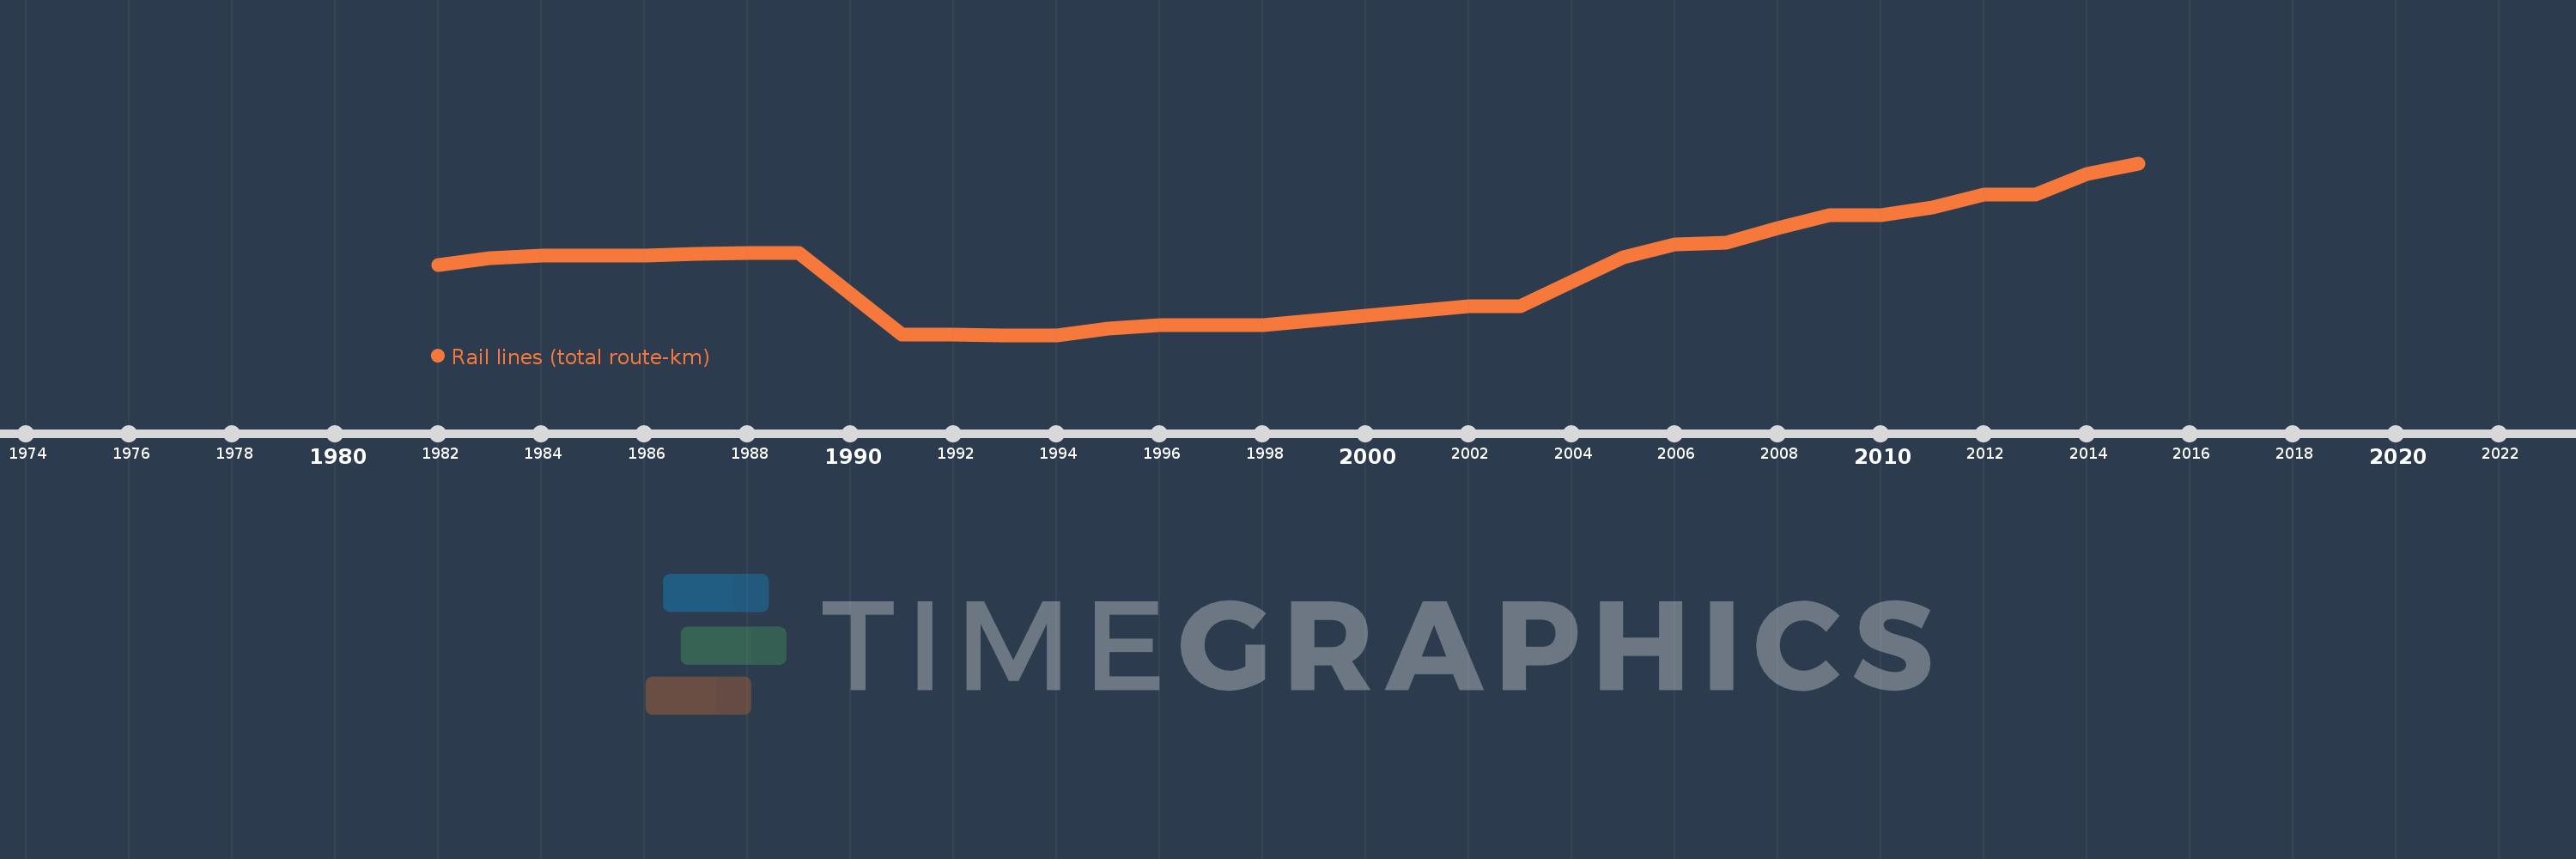
Rail lines (total route-km)
2015,2014,2013,2012,2011,2010,2009,2008,2007,2006,2005,2003,2002,1998,1996,1995,1994,1993,1992,1991,1989,1988,1987,1986,1985,1984,1983,1982
This statistics in other country:
Timeline:
This timeline shows a graph from 1982 to 2015 of Israel. No data until 1981. Number of actual observations by date: 28.
Source name:
World Development Indicators
Source organization:
World Bank, Transportation, Water, and Information and Communications Technologies Department, Transport Division.
Categories, topics:
Infrastructure
Last updated:
apr 23, 2017
Indicators value changes by year
Maximum:
1.193K
jan 1, 2015
At the date of observation
Value
Absolute change
Change from previous value
jan 1, 1982
827.0
+827.0
0.0%
jan 1, 1983
851.0
+24.0
2.9%
jan 1, 1984
859.0
+8.0
0.94%
jan 1, 1985
859.0
0.0
0.0%
jan 1, 1986
859.0
0.0
0.0%
jan 1, 1987
865.0
+6.0
0.7%
jan 1, 1988
869.0
+4.0
0.46%
jan 1, 1989
869.0
0.0
0.0%
jan 1, 1991
574.0
-295.0
-33.95%
jan 1, 1992
574.0
0.0
0.0%
jan 1, 1993
573.0
-1.0
-0.17%
jan 1, 1994
573.0
0.0
0.0%
jan 1, 1995
596.0
+23.0
4.01%
jan 1, 1996
610.0
+14.0
2.35%
jan 1, 1998
610.0
0.0
0.0%
jan 1, 2002
676.0
+66.0
10.82%
jan 1, 2003
676.0
0.0
0.0%
jan 1, 2005
853.0
+177.0
26.18%
jan 1, 2006
899.0
+46.0
5.39%
jan 1, 2007
905.0
+6.0
0.67%
jan 1, 2008
958.0
+53.0
5.86%
jan 1, 2009
1.005K
+47.0
4.91%
jan 1, 2010
1.005K
0.0
0.0%
jan 1, 2011
1.034K
+29.0
2.89%
jan 1, 2012
1.079K
+45.0
4.35%
jan 1, 2013
1.079K
0.0
0.0%
jan 1, 2014
1.153K
+74.0
6.86%
jan 1, 2015
1.193K
+40.0
3.47%
Ranking of countries by current statistics by years


Comments: