29
/
en
AIzaSyAYiBZKx7MnpbEhh9jyipgxe19OcubqV5w
April 1, 2024
208384
Netherlands
NLD
true
2
1
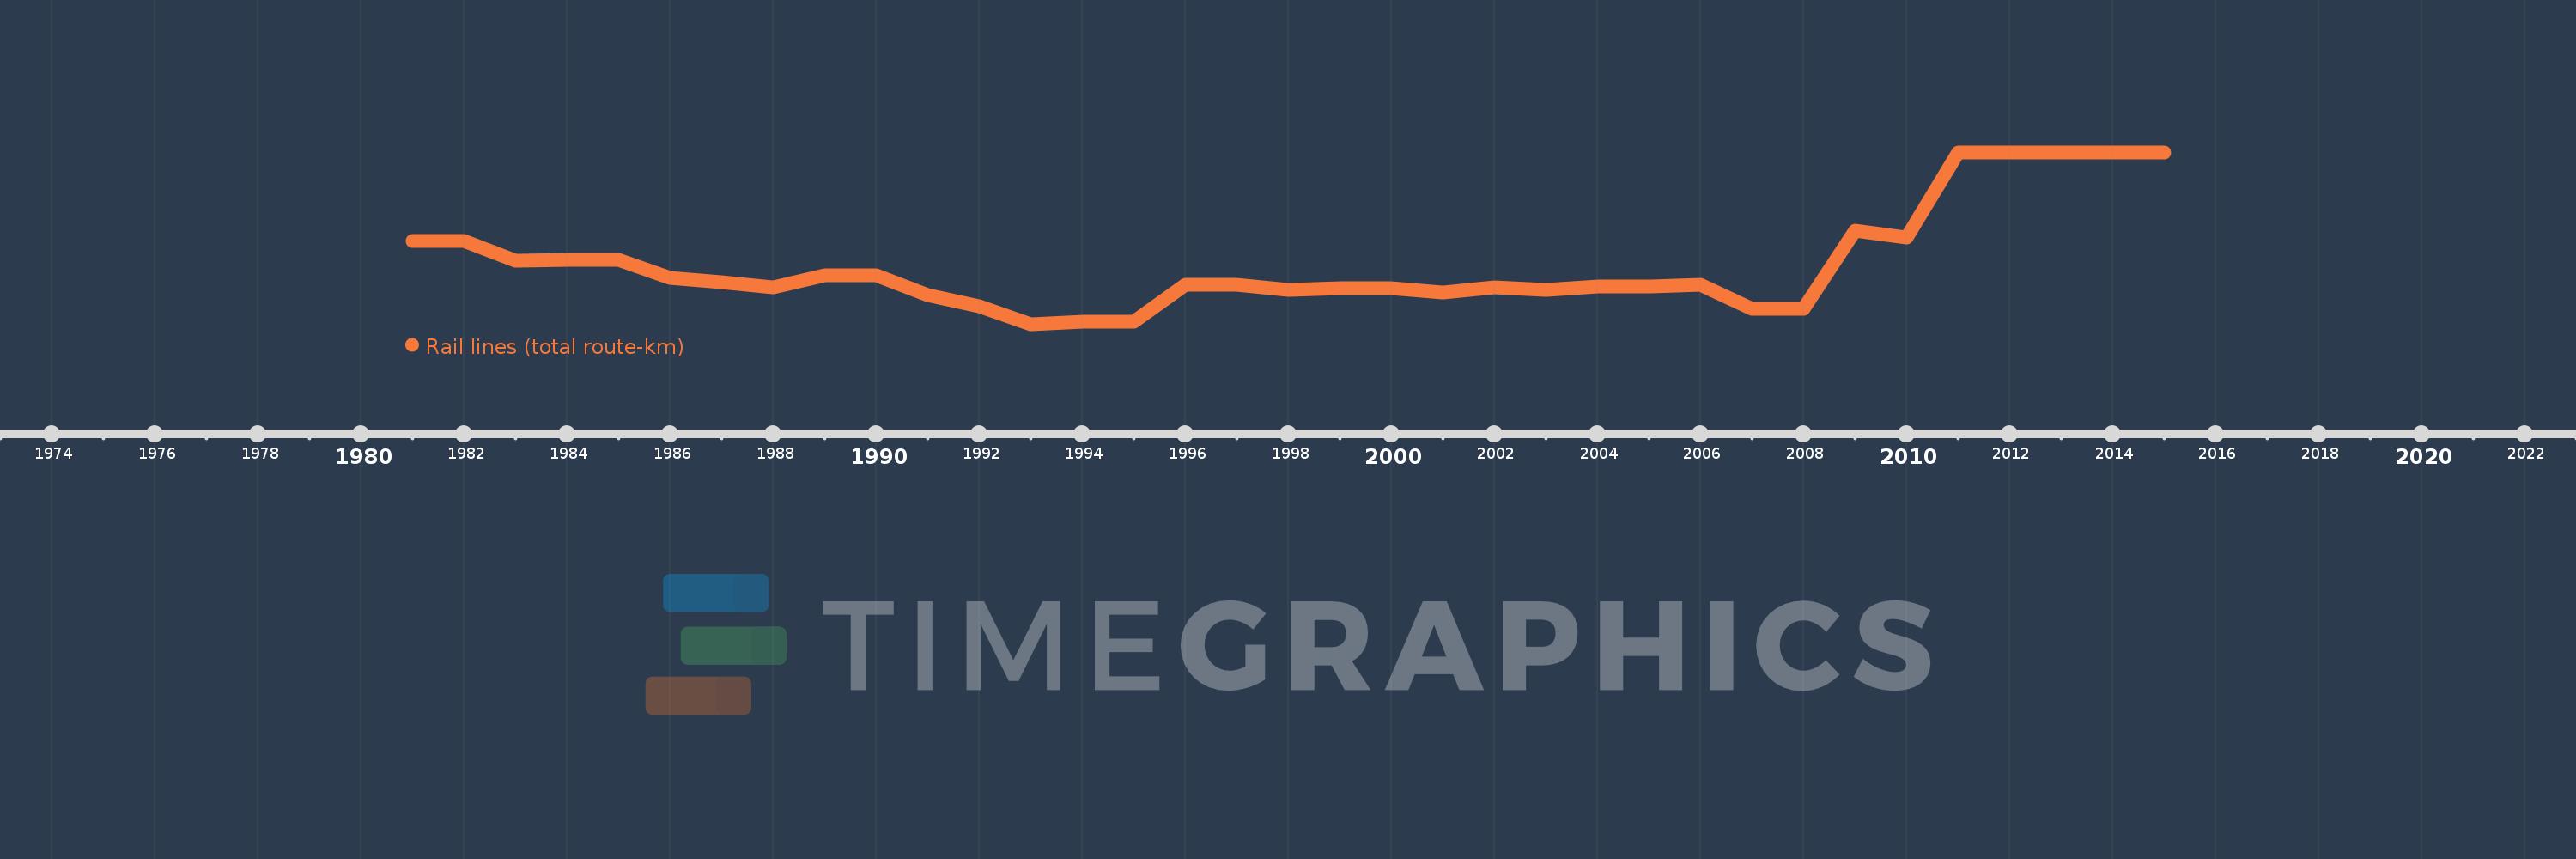
Rail lines (total route-km)
2015,2014,2013,2012,2011,2010,2009,2008,2007,2006,2005,2004,2003,2002,2001,2000,1999,1998,1997,1996,1995,1994,1993,1992,1991,1990,1989,1988,1987,1986,1985,1984,1983,1982,1981
This statistics in other country:
Timeline:
This timeline shows a graph from 1981 to 2015 of Netherlands. No data until 1980. Number of actual observations by date: 35.
Source name:
World Development Indicators
Source organization:
World Bank, Transportation, Water, and Information and Communications Technologies Department, Transport Division.
Categories, topics:
Infrastructure
Last updated:
apr 23, 2017
Indicators value changes by year
Minimum:
2.753K
jan 1, 1993
Maximum:
3.016K
jan 1, 2011
At the date of observation
Value
Absolute change
Change from previous value
jan 1, 1981
2.88K
+2.88K
0.0%
jan 1, 1982
2.88K
0.0
0.0%
jan 1, 1983
2.85K
-30.0
-1.04%
jan 1, 1984
2.852K
+2.0
0.07%
jan 1, 1985
2.852K
0.0
0.0%
jan 1, 1986
2.824K
-28.0
-0.98%
jan 1, 1987
2.817K
-7.0
-0.25%
jan 1, 1988
2.809K
-8.0
-0.28%
jan 1, 1989
2.828K
+19.0
0.68%
jan 1, 1990
2.828K
0.0
0.0%
jan 1, 1991
2.798K
-30.0
-1.06%
jan 1, 1992
2.78K
-18.0
-0.64%
jan 1, 1993
2.753K
-27.0
-0.97%
jan 1, 1994
2.757K
+4.0
0.15%
jan 1, 1995
2.757K
0.0
0.0%
jan 1, 1996
2.813K
+56.0
2.03%
jan 1, 1997
2.813K
0.0
0.0%
jan 1, 1998
2.805K
-8.0
-0.28%
jan 1, 1999
2.808K
+3.0
0.11%
jan 1, 2000
2.808K
0.0
0.0%
jan 1, 2001
2.802K
-6.0
-0.21%
jan 1, 2002
2.809K
+7.0
0.25%
jan 1, 2003
2.806K
-3.0
-0.11%
jan 1, 2004
2.811K
+5.0
0.18%
jan 1, 2005
2.811K
0.0
0.0%
jan 1, 2006
2.813K
+2.0
0.07%
jan 1, 2007
2.776K
-37.0
-1.32%
jan 1, 2008
2.776K
0.0
0.0%
jan 1, 2009
2.896K
+120.0
4.32%
jan 1, 2010
2.886K
-10.0
-0.35%
jan 1, 2011
3.016K
+130.0
4.5%
jan 1, 2012
3.016K
0.0
0.0%
jan 1, 2013
3.016K
0.0
0.0%
jan 1, 2014
3.016K
0.0
0.0%
jan 1, 2015
3.016K
0.0
0.0%
Ranking of countries by current statistics by years


Comments: