29
/
en
AIzaSyAYiBZKx7MnpbEhh9jyipgxe19OcubqV5w
April 1, 2024
75660
Azerbaijan
AZE
true
2
1
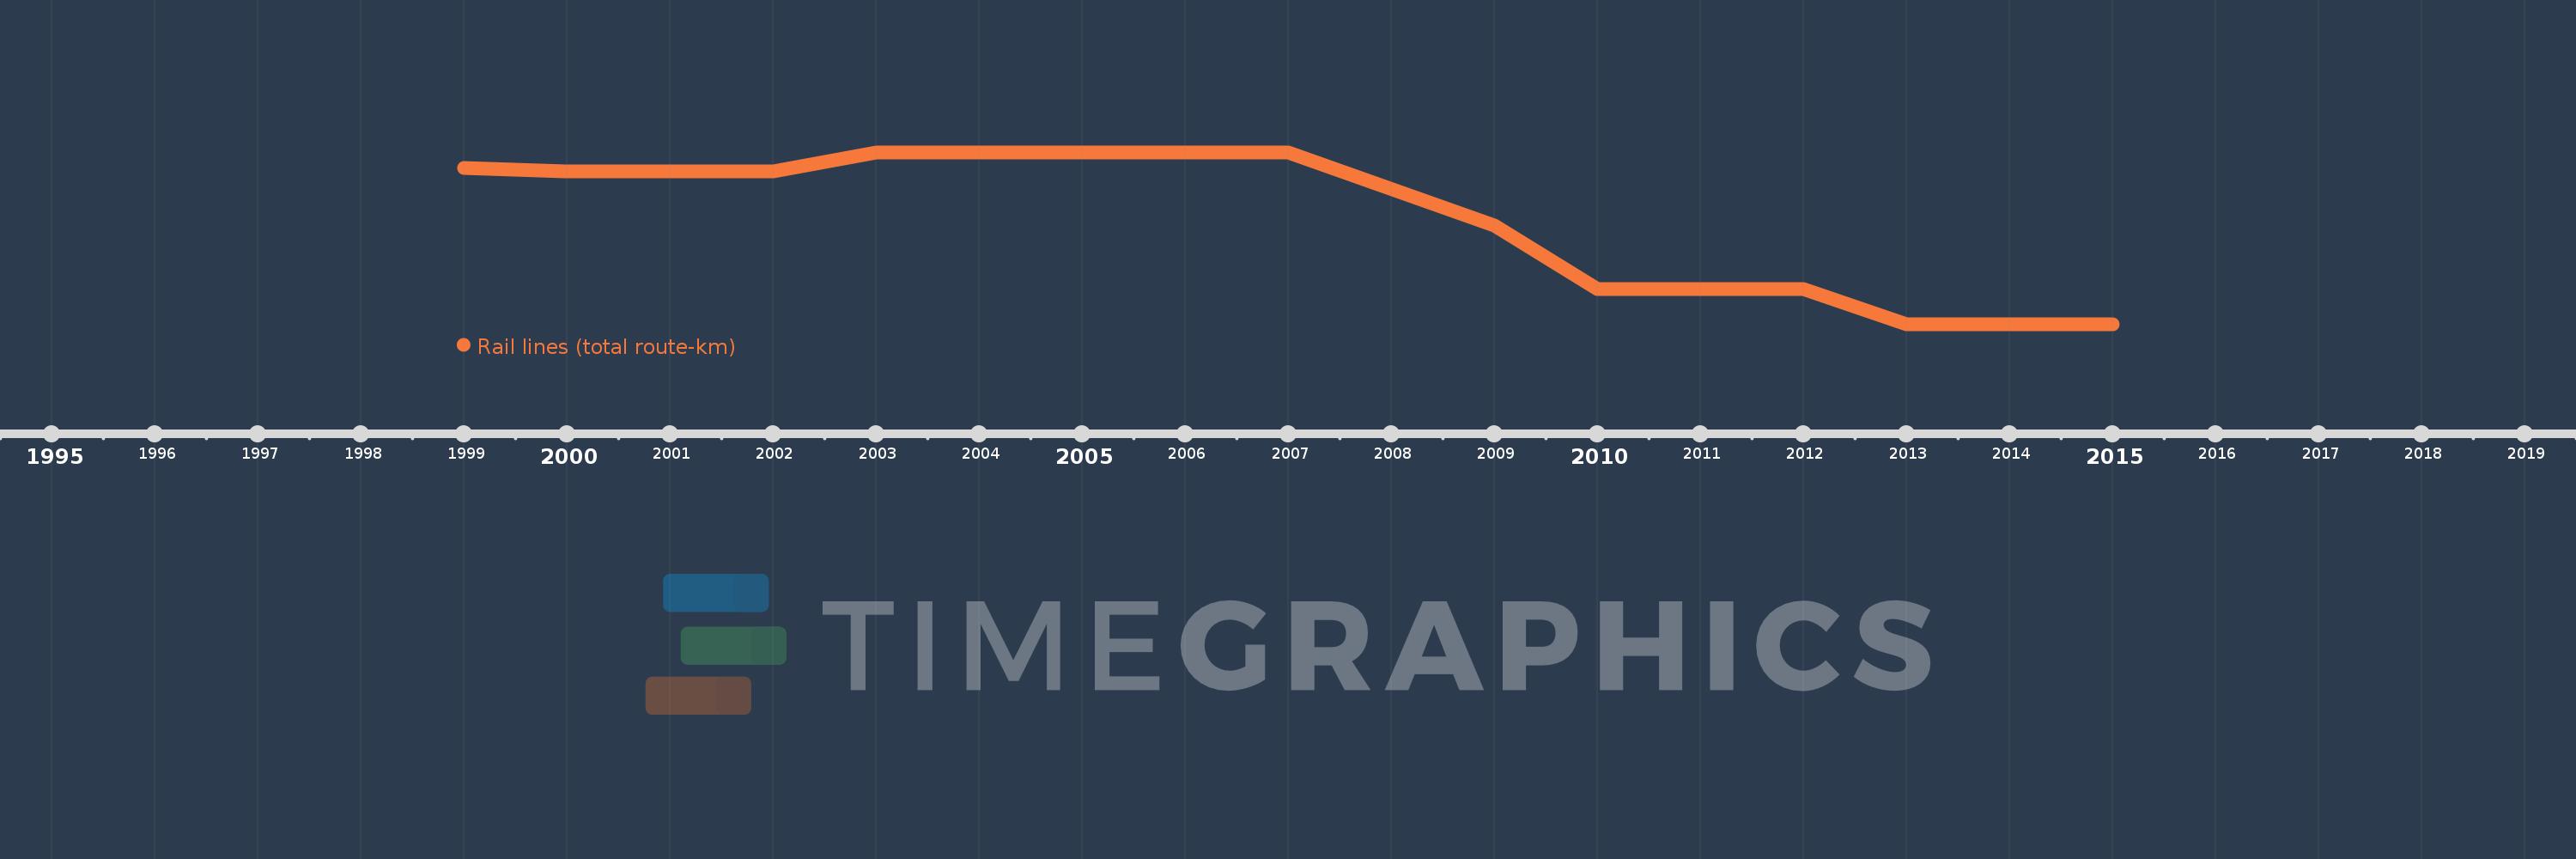
Rail lines (total route-km)
2015,2014,2013,2012,2011,2010,2009,2007,2006,2005,2003,2002,2001,2000,1999
This statistics in other country:
Timeline:
This timeline shows a graph from 1999 to 2015 of Azerbaijan. No data until 1998. Number of actual observations by date: 15.
Source name:
World Development Indicators
Source organization:
World Bank, Transportation, Water, and Information and Communications Technologies Department, Transport Division.
Categories, topics:
Infrastructure
Last updated:
apr 23, 2017
Indicators value changes by year
Minimum:
2.068K
jan 1, 2013
Maximum:
2.122K
jan 1, 2003
At the date of observation
Value
Absolute change
Change from previous value
jan 1, 1999
2.117K
+2.117K
0.0%
jan 1, 2000
2.116K
-1.0
-0.05%
jan 1, 2001
2.116K
0.0
0.0%
jan 1, 2002
2.116K
0.0
0.0%
jan 1, 2003
2.122K
+6.0
0.28%
jan 1, 2005
2.122K
0.0
0.0%
jan 1, 2006
2.122K
0.0
0.0%
jan 1, 2007
2.122K
0.0
0.0%
jan 1, 2009
2.099K
-23.0
-1.08%
jan 1, 2010
2.079K
-20.0
-0.95%
jan 1, 2011
2.079K
0.0
0.0%
jan 1, 2012
2.079K
0.0
0.0%
jan 1, 2013
2.068K
-11.0
-0.53%
jan 1, 2014
2.068K
0.0
0.0%
jan 1, 2015
2.068K
0.0
0.0%
Ranking of countries by current statistics by years


Comments: