29
/
en
AIzaSyAYiBZKx7MnpbEhh9jyipgxe19OcubqV5w
April 1, 2024
138698
Georgia
GEO
true
2
1
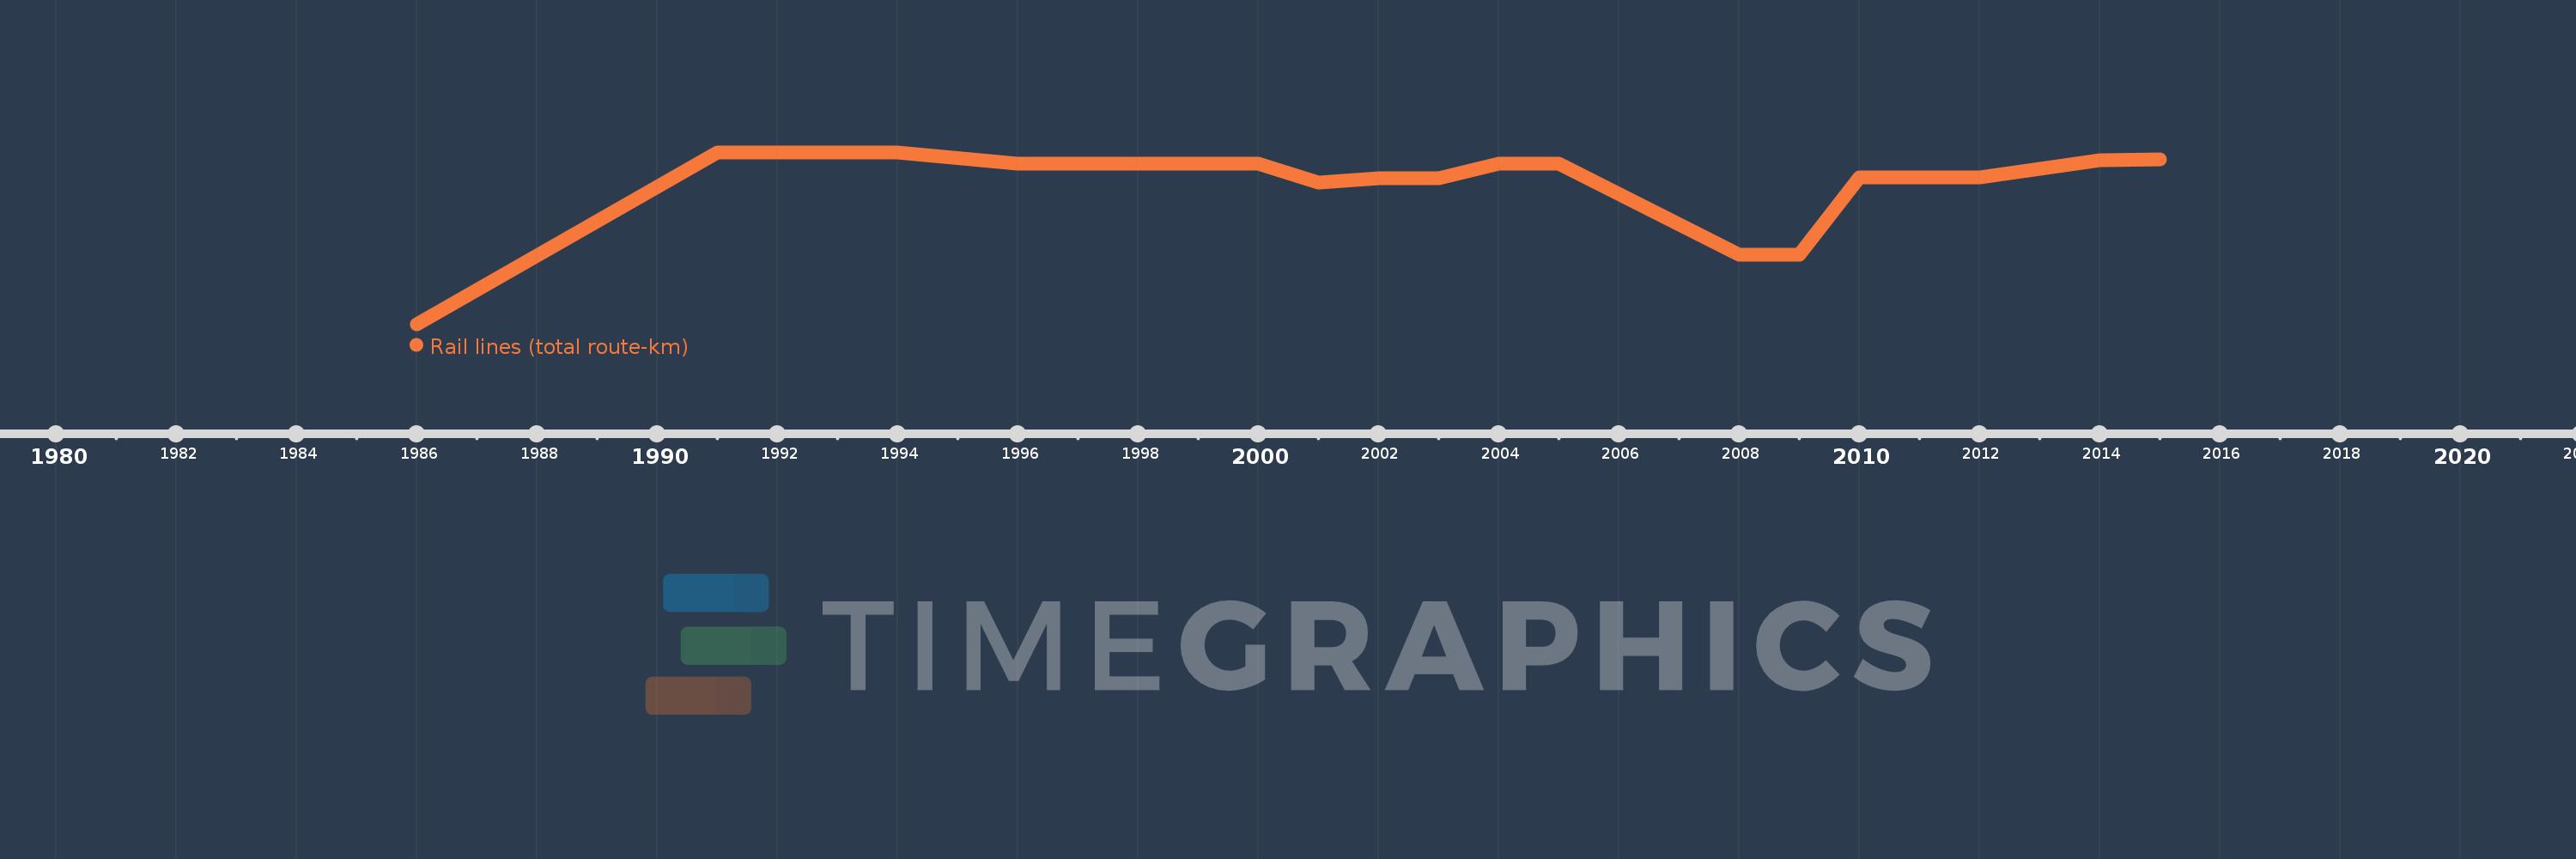
Rail lines (total route-km)
2015,2014,2012,2011,2010,2009,2008,2005,2004,2003,2002,2001,2000,1999,1998,1997,1996,1994,1993,1991,1986
This statistics in other country:
Timeline:
This timeline shows a graph from 1986 to 2015 of Georgia. No data until 1985. Number of actual observations by date: 21.
Source name:
World Development Indicators
Source organization:
World Bank, Transportation, Water, and Information and Communications Technologies Department, Transport Division.
Categories, topics:
Infrastructure
Last updated:
apr 23, 2017
Indicators value changes by year
Minimum:
1.465K
jan 1, 1986
Maximum:
1.583K
jan 1, 1991
At the date of observation
Value
Absolute change
Change from previous value
jan 1, 1986
1.465K
+1.465K
0.0%
jan 1, 1991
1.583K
+118.0
8.05%
jan 1, 1993
1.583K
0.0
0.0%
jan 1, 1994
1.583K
0.0
0.0%
jan 1, 1996
1.575K
-8.0
-0.51%
jan 1, 1997
1.575K
0.0
0.0%
jan 1, 1998
1.575K
0.0
0.0%
jan 1, 1999
1.575K
0.0
0.0%
jan 1, 2000
1.575K
0.0
0.0%
jan 1, 2001
1.562K
-13.0
-0.83%
jan 1, 2002
1.565K
+3.0
0.19%
jan 1, 2003
1.565K
0.0
0.0%
jan 1, 2004
1.575K
+10.0
0.64%
jan 1, 2005
1.575K
0.0
0.0%
jan 1, 2008
1.513K
-62.0
-3.94%
jan 1, 2009
1.513K
0.0
0.0%
jan 1, 2010
1.566K
+53.0
3.5%
jan 1, 2011
1.566K
0.0
0.0%
jan 1, 2012
1.566K
0.0
0.0%
jan 1, 2014
1.578K
+11.6
0.74%
jan 1, 2015
1.578K
+0.4
0.03%
Ranking of countries by current statistics by years


Comments: