29
/
en
AIzaSyAYiBZKx7MnpbEhh9jyipgxe19OcubqV5w
April 1, 2024
70460
Argentina
ARG
true
2
1
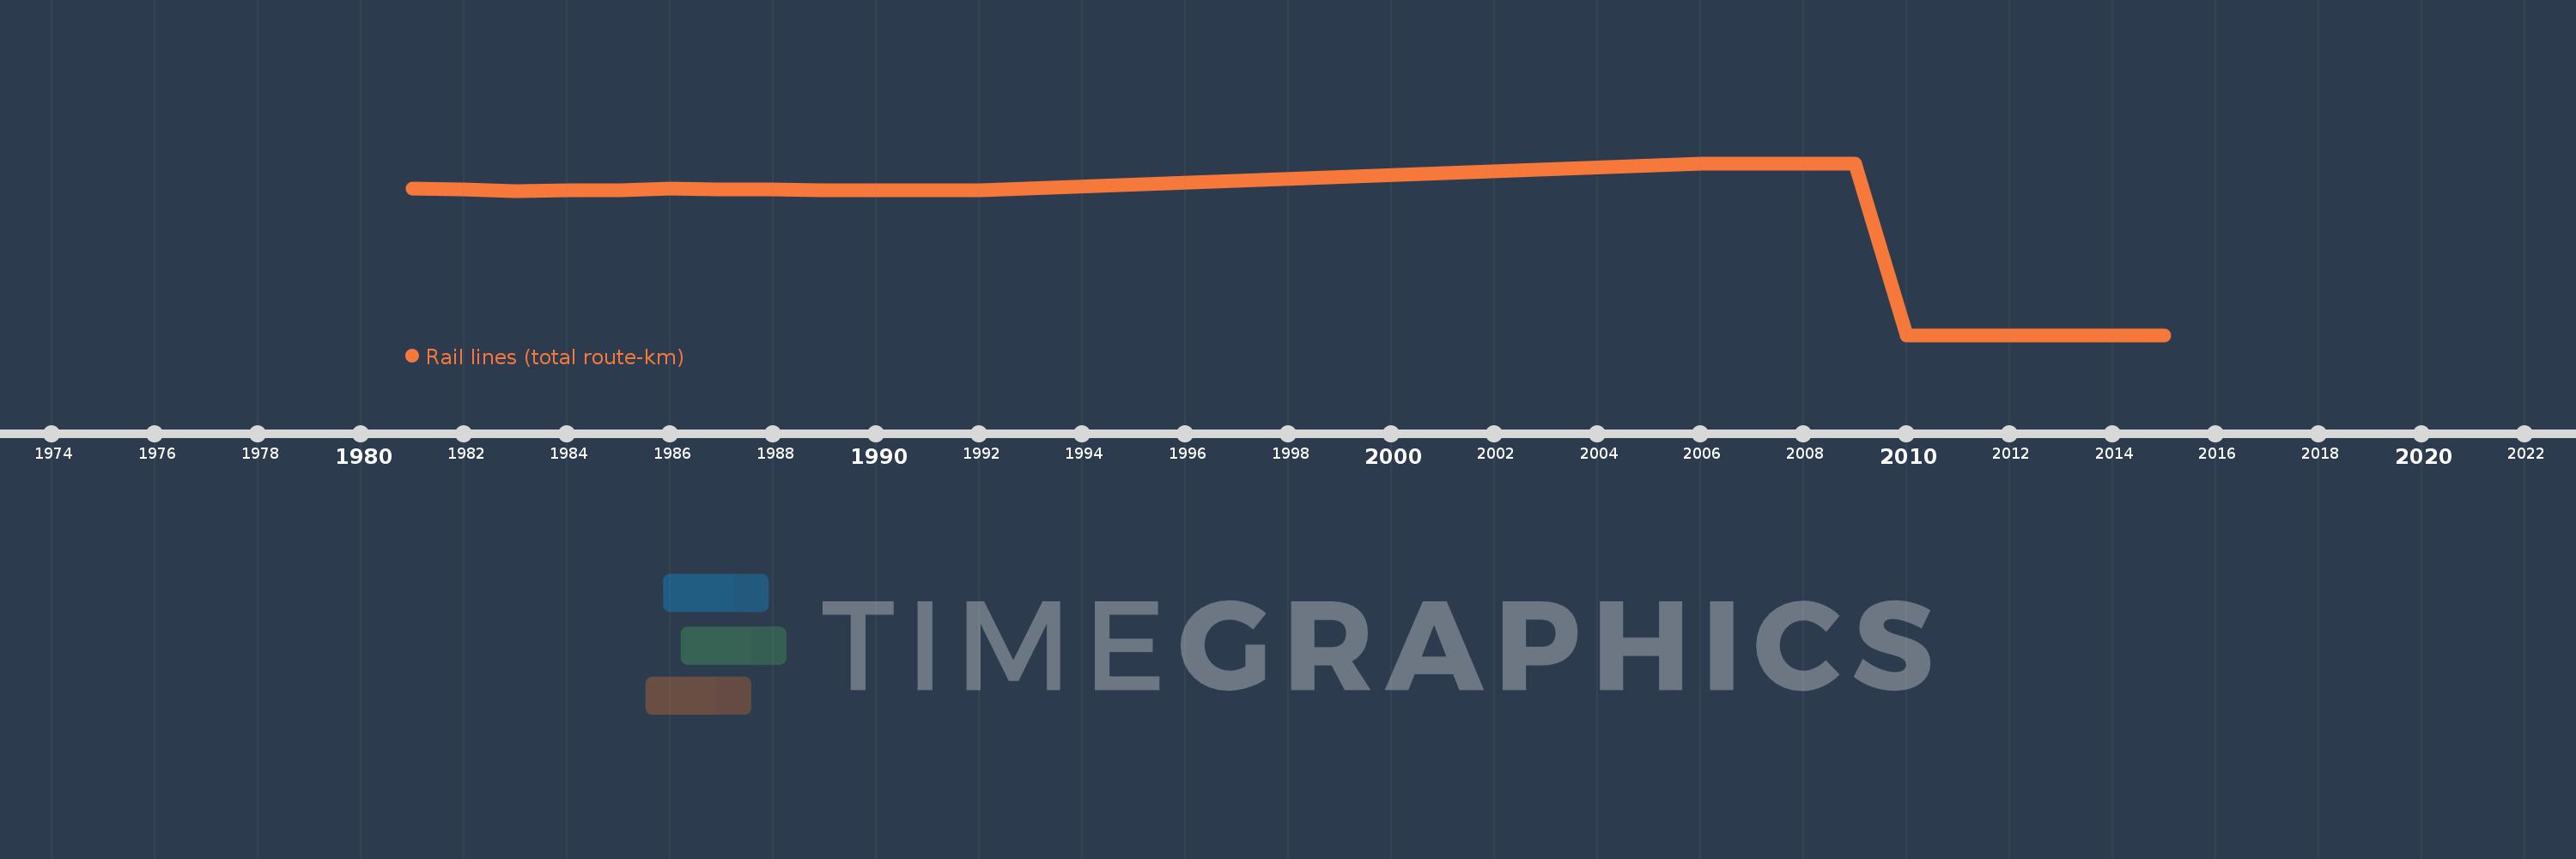
Rail lines (total route-km)
2015,2014,2013,2012,2011,2010,2009,2008,2007,2006,1992,1991,1990,1989,1988,1987,1986,1985,1984,1983,1982,1981
This statistics in other country:
Timeline:
This timeline shows a graph from 1981 to 2015 of Argentina. No data until 1980. Number of actual observations by date: 22.
Source name:
World Development Indicators
Source organization:
World Bank, Transportation, Water, and Information and Communications Technologies Department, Transport Division.
Categories, topics:
Infrastructure
Last updated:
apr 23, 2017
Indicators value changes by year
Minimum:
25.023K
jan 1, 2010
Maximum:
35.753K
jan 1, 2006
At the date of observation
Value
Absolute change
Change from previous value
jan 1, 1981
34.192K
+34.192K
0.0%
jan 1, 1982
34.106K
-86.0
-0.25%
jan 1, 1983
34.029K
-77.0
-0.23%
jan 1, 1984
34.061K
+32.0
0.09%
jan 1, 1985
34.057K
-4.0
-0.01%
jan 1, 1986
34.159K
+102.0
0.3%
jan 1, 1987
34.14K
-19.0
-0.06%
jan 1, 1988
34.14K
0.0
0.0%
jan 1, 1989
34.059K
-81.0
-0.24%
jan 1, 1990
34.059K
0.0
0.0%
jan 1, 1991
34.059K
0.0
0.0%
jan 1, 1992
34.059K
0.0
0.0%
jan 1, 2006
35.753K
+1.694K
4.97%
jan 1, 2007
35.753K
0.0
0.0%
jan 1, 2008
35.753K
0.0
0.0%
jan 1, 2009
35.753K
0.0
0.0%
jan 1, 2010
25.023K
-10.73K
-30.01%
jan 1, 2011
25.023K
0.0
0.0%
jan 1, 2012
25.023K
0.0
0.0%
jan 1, 2013
25.023K
0.0
0.0%
jan 1, 2014
25.023K
0.0
0.0%
jan 1, 2015
25.023K
0.0
0.0%
Ranking of countries by current statistics by years


Comments: