29
/
en
AIzaSyAYiBZKx7MnpbEhh9jyipgxe19OcubqV5w
April 1, 2024
60524
Sub-Saharan Africa (IDA & IBRD countries)
TSS
false
2
1
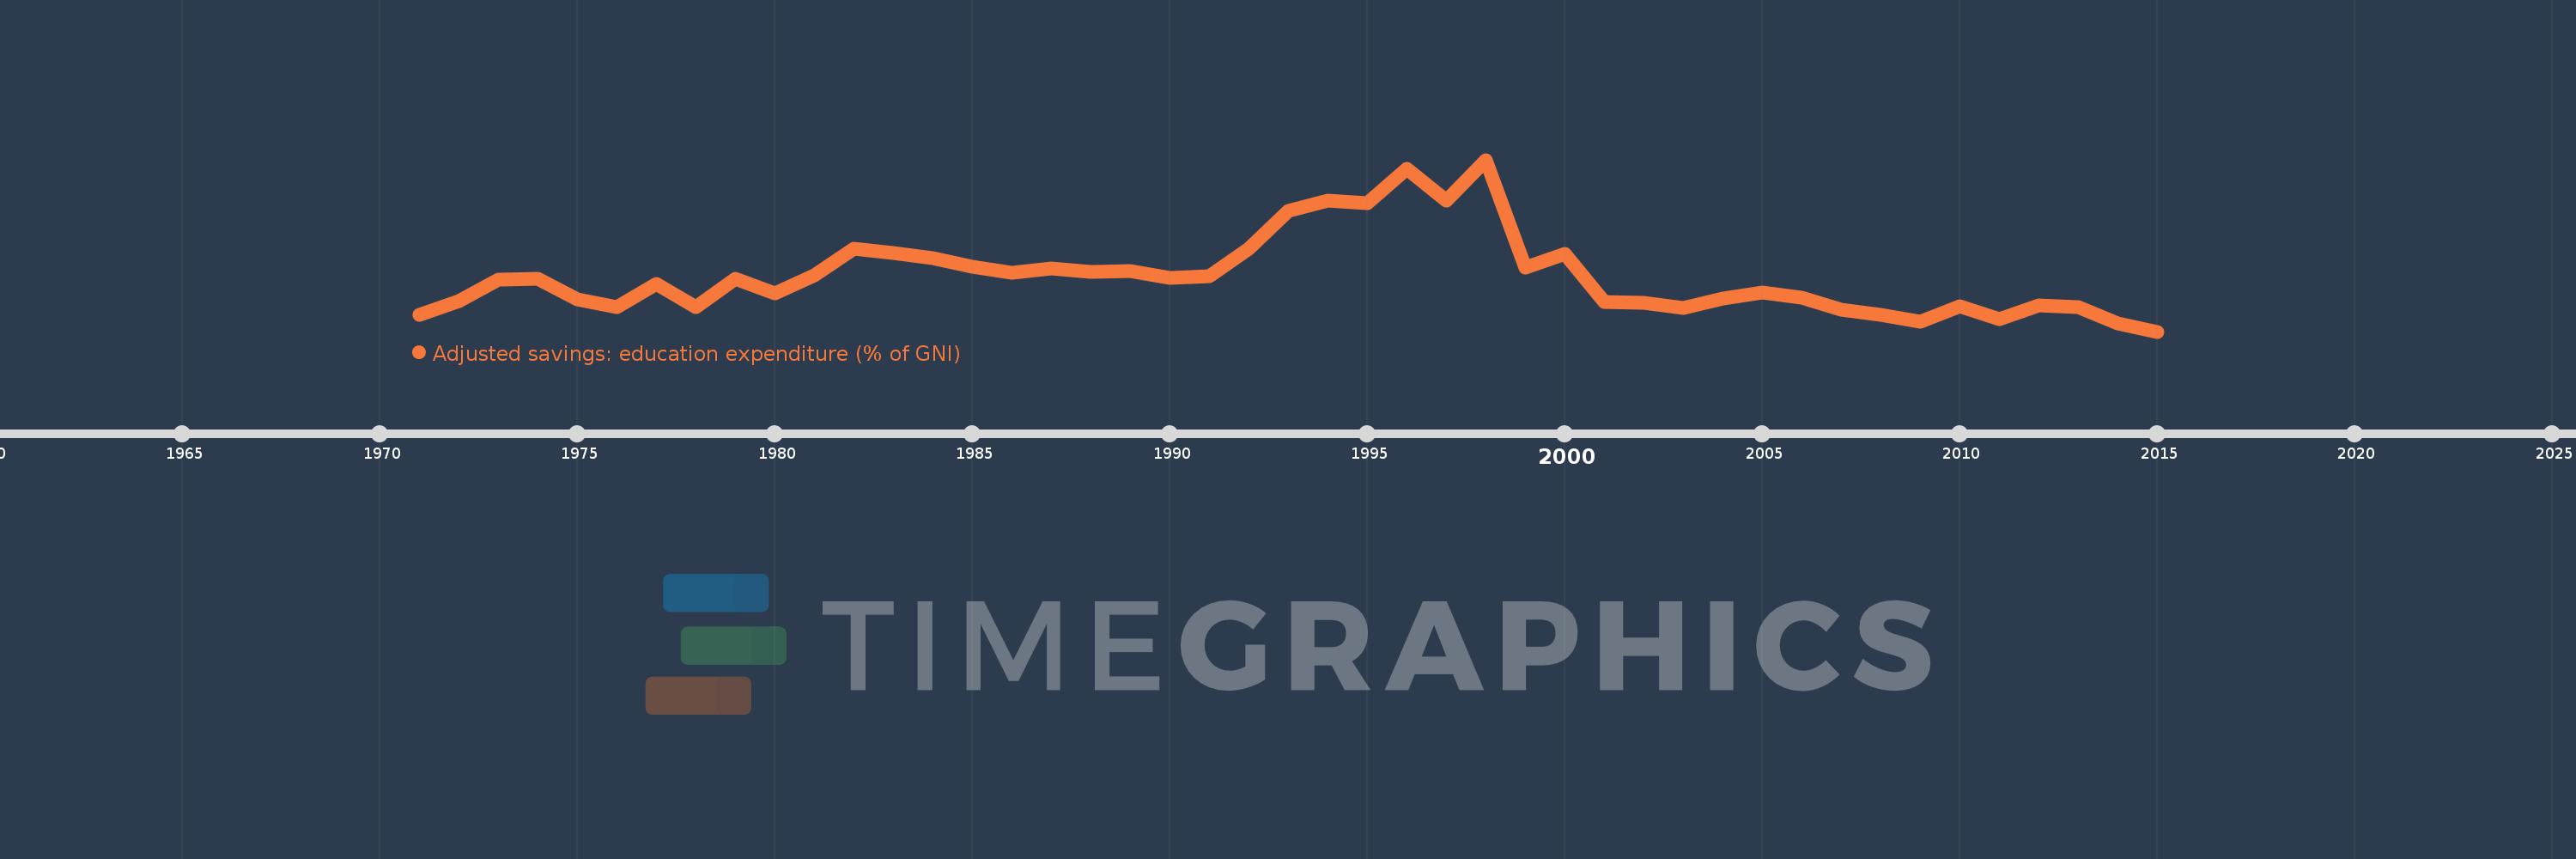
Adjusted savings: education expenditure (% of GNI)
2015,2014,2013,2012,2011,2010,2009,2008,2007,2006,2005,2004,2003,2002,2001,2000,1999,1998,1997,1996,1995,1994,1993,1992,1991,1990,1989,1988,1987,1986,1985,1984,1983,1982,1981,1980,1979,1978,1977,1976,1975,1974,1973,1972,1971
This statistics in other country:
AfghanistanAlbaniaAlgeriaAmerican SamoaAndorraAngolaAntigua and BarbudaArab WorldArgentinaArmeniaAustraliaAustriaAzerbaijanBahamas, TheBahrainBangladeshBarbadosBelarusBelgiumBelizeBeninBermudaBhutanBoliviaBotswanaBrazilBrunei DarussalamBulgariaBurkina FasoBurundiCabo VerdeCambodiaCameroonCanadaCaribbean small statesCentral African RepublicCentral Europe and the BalticsChadChileChinaColombiaComorosCongo, Dem. Rep.Congo, Rep.Costa RicaCote d'IvoireCroatiaCubaCyprusCzech RepublicDenmarkDjiboutiDominicaDominican RepublicEarly-demographic dividendEast Asia & PacificEast Asia & Pacific (excluding high income)East Asia & Pacific (IDA & IBRD countries)EcuadorEgypt, Arab Rep.El SalvadorEquatorial GuineaEritreaEstoniaEthiopiaEuro areaEurope & Central AsiaEurope & Central Asia (excluding high income)Europe & Central Asia (IDA & IBRD countries)European UnionFijiFinlandFragile and conflict affected situationsFranceFrench PolynesiaGabonGambia, TheGeorgiaGermanyGhanaGreeceGrenadaGuatemalaGuineaGuinea-BissauGuyanaHaitiHeavily indebted poor countries (HIPC)High incomeHondurasHong Kong SAR, ChinaHungaryIBRD onlyIcelandIDA & IBRD totalIDA blendIDA onlyIDA totalIndiaIndonesiaIran, Islamic Rep.IraqIrelandIsraelItalyJamaicaJapanJordanKazakhstanKenyaKiribatiKorea, Rep.KuwaitKyrgyz RepublicLao PDRLate-demographic dividendLatin America & Caribbean Latin America & Caribbean (excluding high income)Latin America & the Caribbean (IDA & IBRD countries)LatviaLeast developed countries: UN classificationLebanonLesothoLiberiaLibyaLiechtensteinLithuaniaLow & middle incomeLow incomeLower middle incomeLuxembourgMacao SAR, ChinaMacedonia, FYRMadagascarMalawiMalaysiaMaldivesMaliMaltaMarshall IslandsMauritaniaMauritiusMexicoMicronesia, Fed. Sts.Middle East & North AfricaMiddle East & North Africa (excluding high income)Middle East & North Africa (IDA & IBRD countries)Middle incomeMoldovaMonacoMongoliaMoroccoMozambiqueMyanmarNamibiaNepalNetherlandsNew CaledoniaNew ZealandNicaraguaNigerNigeriaNorth AmericaNorwayOECD membersOmanOther small statesPacific island small statesPakistanPanamaPapua New GuineaParaguayPeruPhilippinesPolandPortugalPost-demographic dividendPre-demographic dividendPuerto RicoQatarRomaniaRussian FederationRwandaSamoaSan MarinoSao Tome and PrincipeSaudi ArabiaSenegalSerbiaSeychellesSierra LeoneSingaporeSlovak RepublicSloveniaSmall statesSolomon IslandsSomaliaSouth AfricaSouth AsiaSouth Asia (IDA & IBRD)SpainSri LankaSt. Kitts and NevisSt. LuciaSt. Vincent and the GrenadinesSub-Saharan Africa Sub-Saharan Africa (excluding high income)Sub-Saharan Africa (IDA & IBRD countries)SudanSurinameSwazilandSwedenSwitzerlandSyrian Arab RepublicTajikistanTanzaniaThailandTimor-LesteTogoTongaTrinidad and TobagoTunisiaTurkeyTurkmenistanUgandaUkraineUnited KingdomUnited StatesUpper middle incomeUruguayUzbekistanVanuatuVenezuela, RBVietnamVirgin Islands (U.S.)WorldYemen, Rep.ZambiaZimbabwe Timeline:
This timeline shows a graph from 1971 to 2015 of Sub-Saharan Africa (IDA & IBRD countries). No data until 1970. Number of actual observations by date: 45.
Source name:
World Development Indicators
Source organization:
World Bank staff estimates using data from the United Nations Statistics Division's Statistical Yearbook, and the UNESCO Institute for Statistics online database.
Categories, topics:
Economy & Growth, Environment
Last updated:
apr 23, 2017
Indicators value changes by year
At the date of observation
Value
Absolute change
Change from previous value
jan 1, 1971
3.466
+3.466
0.0%
jan 1, 1972
3.696
+0.231
6.66%
jan 1, 1973
4.04
+0.343
9.29%
jan 1, 1974
4.057
+0.017
0.43%
jan 1, 1975
3.717
-0.34
-8.39%
jan 1, 1976
3.585
-0.132
-3.54%
jan 1, 1977
3.966
+0.381
10.63%
jan 1, 1978
3.591
-0.375
-9.46%
jan 1, 1979
4.062
+0.471
13.11%
jan 1, 1980
3.818
-0.244
-6.0%
jan 1, 1981
4.112
+0.294
7.69%
jan 1, 1982
4.557
+0.446
10.84%
jan 1, 1983
4.482
-0.075
-1.65%
jan 1, 1984
4.399
-0.083
-1.85%
jan 1, 1985
4.253
-0.146
-3.31%
jan 1, 1986
4.154
-0.099
-2.33%
jan 1, 1987
4.228
+0.074
1.78%
jan 1, 1988
4.17
-0.059
-1.38%
jan 1, 1989
4.188
+0.018
0.44%
jan 1, 1990
4.075
-0.113
-2.7%
jan 1, 1991
4.1
+0.025
0.62%
jan 1, 1992
4.556
+0.456
11.11%
jan 1, 1993
5.175
+0.619
13.59%
jan 1, 1994
5.342
+0.167
3.23%
jan 1, 1995
5.3
-0.043
-0.8%
jan 1, 1996
5.862
+0.562
10.61%
jan 1, 1997
5.339
-0.523
-8.91%
jan 1, 1998
6.01
+0.671
12.57%
jan 1, 1999
4.243
-1.768
-29.41%
jan 1, 2000
4.465
+0.223
5.25%
jan 1, 2001
3.671
-0.795
-17.79%
jan 1, 2002
3.665
-0.006
-0.16%
jan 1, 2003
3.571
-0.094
-2.56%
jan 1, 2004
3.731
+0.16
4.47%
jan 1, 2005
3.834
+0.103
2.77%
jan 1, 2006
3.753
-0.081
-2.1%
jan 1, 2007
3.545
-0.209
-5.56%
jan 1, 2008
3.464
-0.08
-2.26%
jan 1, 2009
3.357
-0.107
-3.1%
jan 1, 2010
3.612
+0.255
7.6%
jan 1, 2011
3.391
-0.221
-6.11%
jan 1, 2012
3.621
+0.23
6.78%
jan 1, 2013
3.585
-0.037
-1.01%
jan 1, 2014
3.323
-0.262
-7.3%
jan 1, 2015
3.189
-0.135
-4.05%
Ranking of countries by current statistics by years


Comments: